A 4-Step Guide To Tracking Social Media In Google Analytics
Google Analytics is one of the best ways to learn about your website visitors.
And when you couple data from your website with social media, you’ll be able to create a traffic-driving machine to your online assets.
This isn’t an exaggeration. With Google Analytics, you can learn exactly the type of content your audience responds to and the social networks they prefer. With that knowledge, you can drive more traffic and leads to your website—while also proving the ROI of social.
You can even use Google Analytics to track vital social media metrics with just a few simple steps.
This guide will teach you how to do that. But first…
Bonus: Get a free social media analytics report template that shows you the most important metrics to track for each network.
What is Google Analytics?
Google Analytics is a free website analytics dashboard. With it, you have access to a wealth of insights about your website and its visitors.
Think of it like the machines a doctor uses to measure her patients’ vitals. With Google Analytics, you’ll be able to measure the overall health of your website and see areas that need to be fixed.
Here are just a few metrics and insights you can get with the tool:
- Amount of traffic your site gets overall
- The websites your traffic came from
- Individual page traffic
- Amount of leads converted
- The websites your leads came form
- Demographic information of visitors (e.g. where they live)
- Whether your traffic comes from mobile or desktop
That’s all good—but why is any of this important?
Simple: The more you know about your audience and what they like, the more you’ll be able to give them the content that they desire.
It’s the difference between having a vending machine and a private chef. With a vending machine, what you get is what you get. The consumer has no input on what goes in it and how the food tastes.
On the other hand, a private chef will listen to you and give you what you want. They can cater what they cook to your specific needs and desires.
That’s the difference between using Google Analytics and not using it. With Google Analytics, you’ll be able to see what content you produce excites your audience—allowing you to replicate that success.
If you’re not using it, you’ll be flying blind (and your arm might get stuck in the machine).
When you couple Google Analytics with social media, you can get even more insights into what content will be successful—which brings us to…
The powerful combination of Google Analytics and social media
Google Analytics provides you with detailed social media reports that are a boon for any digital marketer.
These reports will allow you to:
- Discover which social media platforms give you the most traffic
- Calculate the ROI of your social media campaigns
- See what content works best with what social media platform
- Make sure that you’re pulling traffic from the right demographics with social media
- See how many sales conversions your business gets from social media
With this data, you’ll be able to get the most out of your social media campaigns and effectively strategize for the future.
Let’s take a look at the exact steps you need to take in order to track social media success with Google Analytics. As well, we’ll take a deep dive into the eight reports you’ll get regarding your social media posts.
How to use Google Analytics to track social media in 4 steps
Step 1: Set S.M.A.R.T. goals
A good, clear goal can mean the difference between a successful social media campaign or an aimless one that goes nowhere.
That’s not an exaggeration. Setting good goals is an important trigger for your business. Knowing exactly what your business needs can give you a roadmap for how to achieve it.
How do you set the goals? Use the S.M.A.R.T. goal framework.
S.M.A.R.T. stands for specific, measurable, attainable, relevant, and timely. Here’s a breakdown of what each term means in relation to your goal:
- Specific. Vague goals are bad goals. That’s why so many people fail when they set New Year’s Resolutions like, “I want to hit the gym”. Rather if your goal was something like, “I want to lose 30 pounds,” you’d have a much better chance of attaining it.
- Measurable. How do you know when you’ve accomplished your goal? Is it when you get a conversion rate of X% on social media? Is it when you increase traffic by XXXX people per month?
- Attainable. It’s good to be ambitious, but if your goal is to make $1 million in conversions the first week of measuring results, you’re going to have a very bad time. Is your goal realistic? Can you achieve it with the current circumstances and obligations in your business?
- Relevant. Your goal should be something that matters to your business right now. Is your goal a pertinent issue? What would happen if you didn’t achieve it? How would that impact your business?
- Timely. If you have a time constraint to your goal, it could give you the motivation to accomplish it. Maybe you want to generate XX% more leads via social media by Q4. Or maybe you want to grow revenue by XX% in one year. Time cues like this can be a huge motivator to your business.
Let’s take a look at some S.M.A.R.T. goals in action and compare them to not-as-smart goals.
Bad goal: We want more followers on Instagram.
S.M.A.R.T. goal: We will grow our Instagram following by 100 new followers each week by Q4.
Bad goal: We want more sales through social media.
S.M.A.R.T. goal: We will gain a 0.9% conversion rate on Twitter by the end of the year.
Bad goal: We want to increase traffic.
S.M.A.R.T. goal: We’re going to double the size of our audience on YouTube in two years.
Do you see the difference between these goals? The bad goals are vague. They don’t have a clear framework to get started and no indicator on when you’ve actually achieved the goals.
S.M.A.R.T. goals work because they tell you exactly what you need to do every day and when you need to do it by. It allows your business to build systems to achieve your goal.
Step 2: Install Google Analytics—with Google Tag Manager
To help you organize and structure all of your data, you’re going to want to get a good tag management system (TMS).
A good TMS sends all of the data and metrics from your websites into third party metric analyzers like Facebook Analytics and Google Analytics.
Luckily, Google offers their own TMS with the Google Tag Manager. This tool allows you to painlessly update and add tags to your Google Analytics dashboard without having to have coding knowledge.
Great for any beginner or advanced marketer.
For example, if you wanted to see how many people clicked on a link to watch a video, you could simply add a new tag to your tag manager to get this information. Without it, you’d have to manually change all the links to the video.
To start, create an account on the Google Tag Manager dashboard.
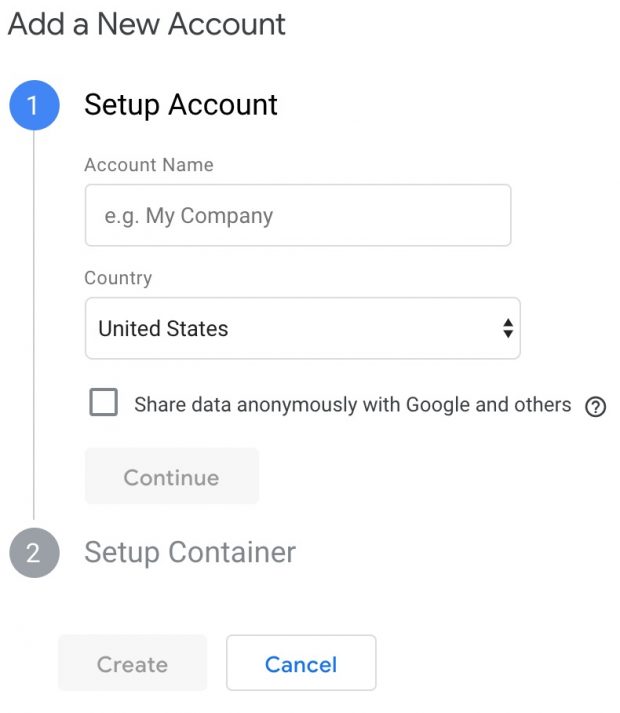
Choose a good account name, the country your business is in, and whether or not you want to share your data with Google. Then click “Continue.”
From here, you’ll be sent to this page:
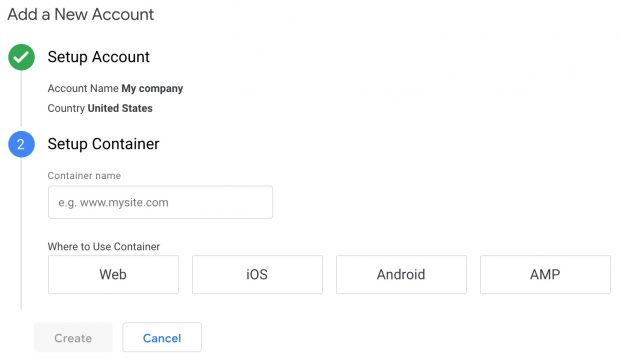
This is where you’ll set up a container.
A container is a bucket that contains all of the macros, rules, and tags for your website.
Enter a name you’d like for your container. Then, choose where your container will be used. Your options are web, iOS, Android, or AMP.
Then click create, review the Terms of Service, and agree to those terms. You’ll then be given the container’s installation code snippet.
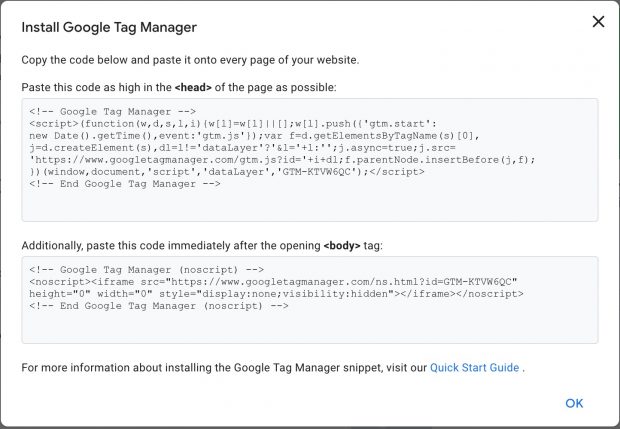
This is the code you’ll need to place on your website in order for it to track and manage your tags.
So copy and paste the two snippets of code onto your website by pasting it in the header and after the body of each of your website’s page.
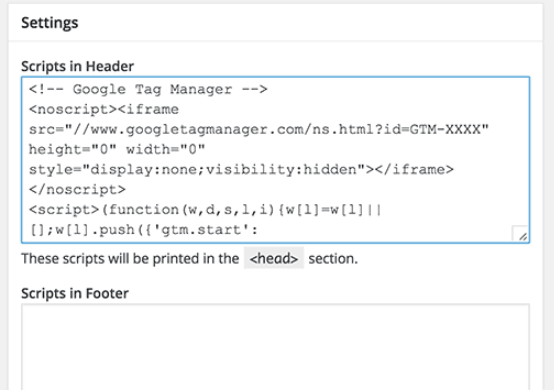
If you’re using WordPress, you’ll be able to simply put the code into your website’s theme.
This is the piece of code you’ll be pasting into your website’s back end in order to manage your tags. To do that, copy and paste the two snippets of code onto every page of your website. As the instructions say, you’ll need to the first one in the header and the second after the opening of the body.
With WordPress, you further streamline the process and install the Insert Headers and Footers plugin. This will allow you to add any script to the Header and Footer throughout your entire website.
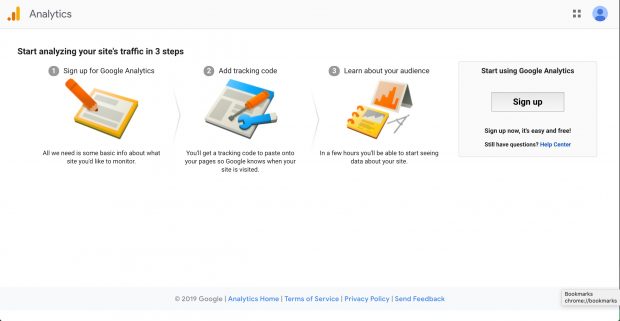
Once you do that, then it’s time to set up Google Analytics. First, create a Google Analytics account by signing up on the GA page.
Then enter your account and website name, as well as the website’s URL.
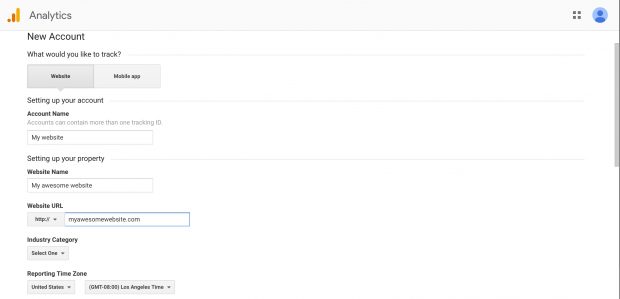
Once you do all that, accept the Terms and Services in order to get your tracking ID.
The tracking ID is a string of numbers that tells Google Analytics to send analytics data to you. It’s a number that looks like UA-000000-1. The first set of numbers (000000) is your personal account number and the second set (1) is the property number associated with your account.
This is unique to your website and your personal data—so don’t share the tracking ID with anyone publicly!
Once you have the tracking ID, it’s time to move onto the next step:
Bonus: Get a free social media analytics report template that shows you the most important metrics to track for each network.
Get the free template now!Step 3: Set up analytics tag with Google Tag manager
Now it’s time to merge Google Tag Manager with Google Analytics.
Go to your Google Tag Manager dashboard and click on the “Add a new tag” button.
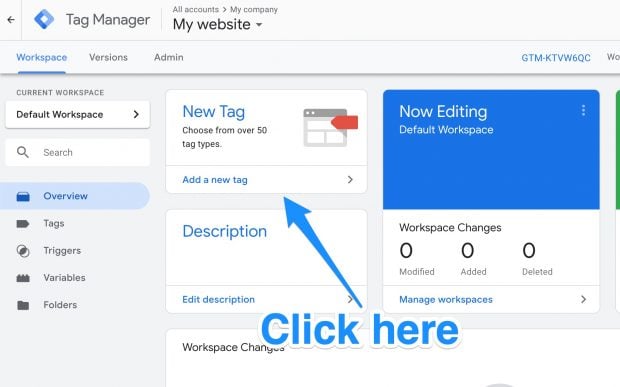
From here you’ll be able to create a new website tag on this page:
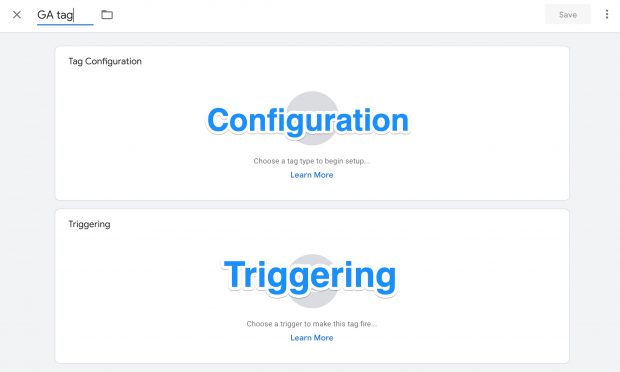
There are two areas of the tag you’ll be able to customize:
- Configuration. Where the data collected by the tag will go.
- Triggering. What type of data you want to collect.
First, click on the “Tag Configuration” button and choose “Universal Analytics” to create a tag for Google Analytics.
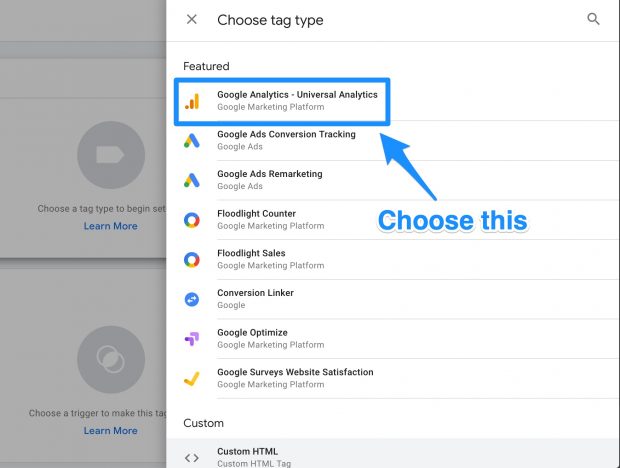
From here, choose the type of data you want to track and then choose “New Variable …” from the dropdown menu under “Google Analytics Settings.”
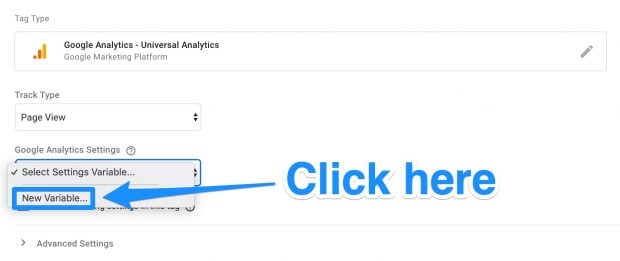
A new window will pop up where you can enter your Google Analytics tracking ID.
![]()
This will send your website’s data straight into Google Analytics.
Once this is done, head to the “Triggering” section in order to select that data you want to send to Google Analytics.
Click on the “Triggering” button in order to be sent to the “Choose a trigger” page.
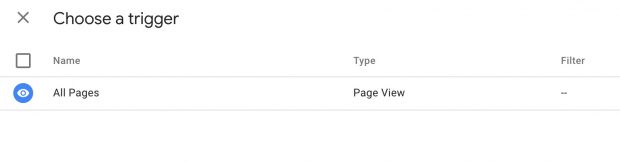
Click on “All pages” so it sends data from all your web pages.
Your new tag set up should look something like this:
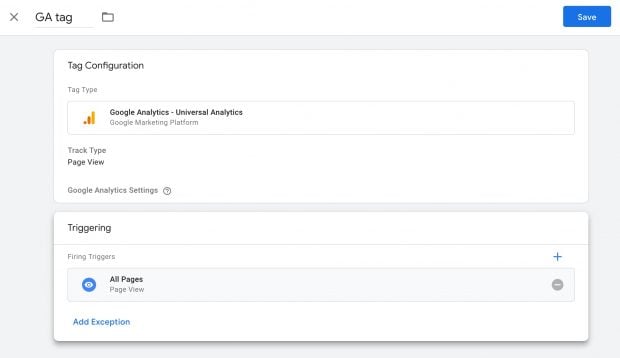
Click save and voila! You have a new Google Tag tracking and sending data to your Google Analytics page about your website.
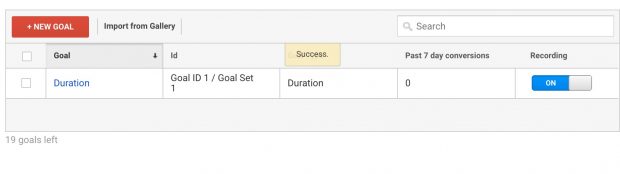
Step 4: Create a goal on Google Analytics
Google Analytics allows you to create “goals” on the dashboard so it can track your website’s key performance indicators.
To do that, leverage the S.M.A.R.T. goal (or goals) you set in the first step. This will be incredibly helpful for you in determining the type of Google Analytics goal you want to set.
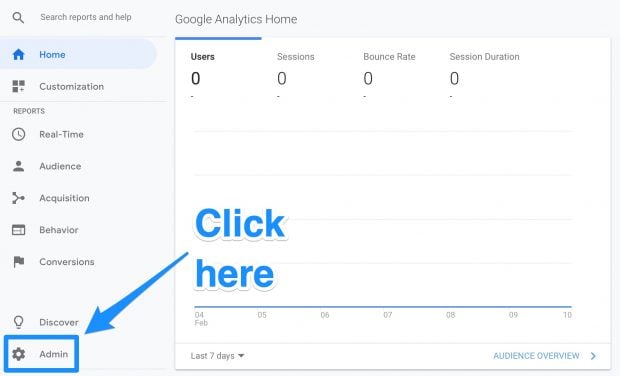
Click on the “Admin” button on the bottom left corner.
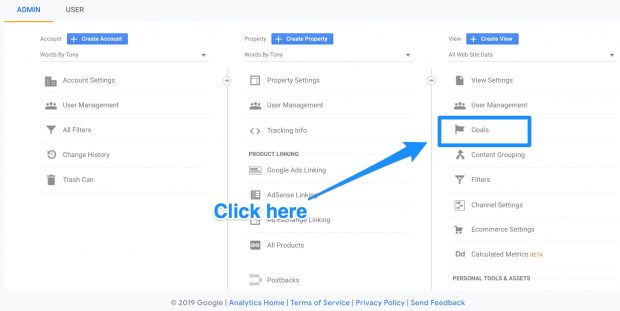
Under the “View” column, click on “Goals.”
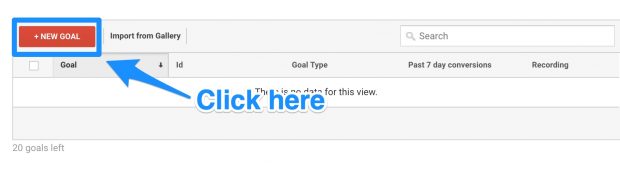
You’ll then be taken to the goals window where you’ll be able to create a new goal.
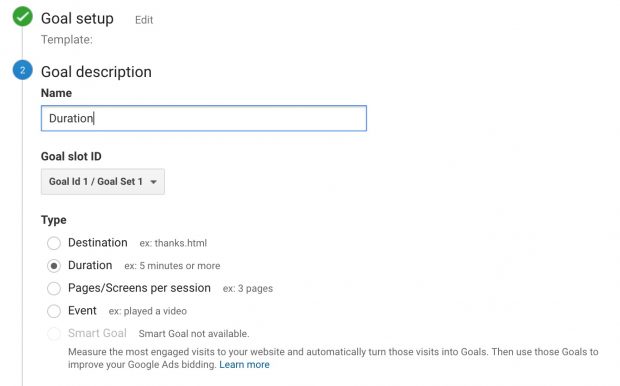
There are a variety of different goal templates you can choose from. See if one of them matches your goal.
You can also see the different types of goals Google Analytics can track for you. They are:
- Destination. e.g. if your goal was for your user to reach a specific web page.
- Duration. e.g. if your goal was for users to spend a specific amount of time on you site.
- Pages/Screens per session. e.g. if your goal was to have users go to a specific amount of pages.
- Event. e.g. if your goal was to get users to play a video or click on a link.
You can get even more specific with your goals like choosing exactly how long users need to spend on your site in order to consider it a success.
Save the goal and Google Analytics will start to track it for you!
Remember: There are ton of different things you can track using both Google Tag Manager and Google Analytics. It’s easy to get overwhelmed. Our recommendation is to track the metrics that matter the most to you.
And we have just the thing to help with that…
8 key things to track on Google Analytics to measure social media success
Google Analytics currently allows you to view eight social analytics reports.
These reports showcase the ROI and impact of your social media campaigns.
To find them, you’ll simply want to go to the “Reporting” tab on your dashboard. From there, click on “Acquisitions” and then “Social.”
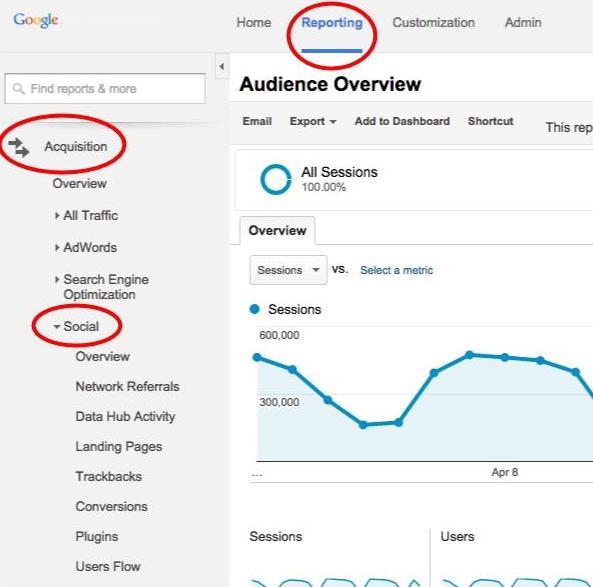
From here, you’ll be able to take a look at the eight big social media reports.
They are:
- Overview report
- Network referrals
- Data Hub Activity
- Landing pages
- Trackbacks
- Conversions
- Plugins
- User flow
Let’s take a look at each report now, with a brief overview of what data you can find on each.
1. Overview report
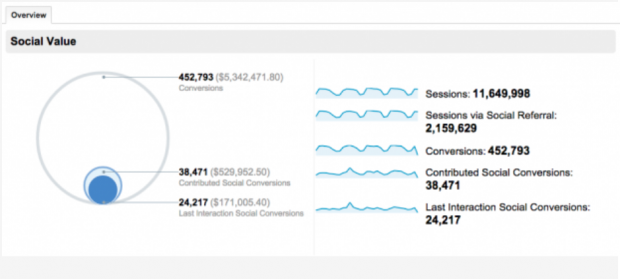
This report gives digital marketers a quick overview of how many people convert via social media platforms. It compares the value of the goal completions with those that are from social referrals.
You’ll be also able to look at numbers like “Assisted Social Conversions” that show the specific number of conversions social media helped with, as well as “Last Interaction Social Conversions” that are conversions created directly from a social media platform.
2. Network referrals
This report gives digital marketers engagement metrics from every social network. You’ll be able to see which social network is giving you a positive ROI and assess the success of a campaign.
3. Data Hub Activity
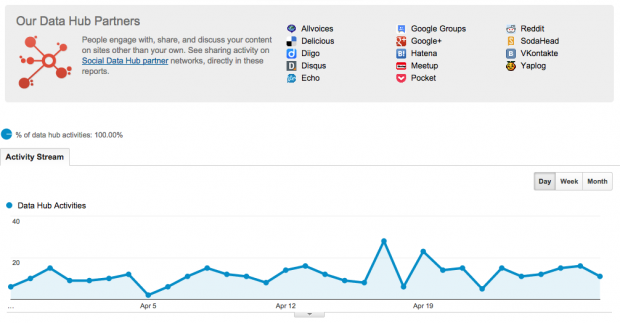
This report shows how many people are engaging with your site’s content and sharing it on social networks.
Some key pieces of data include:
- Most recent URLs people shared
- How they shared your URLs
- What they said
If you’re using a social network that isn’t a part of the data hub such as Facebook, Twitter, LinkedIn, and Pinterest, you’re going to be out of luck. But it is good if you’re using sites like Reddit and Digg to share your content.
4. Landing pages
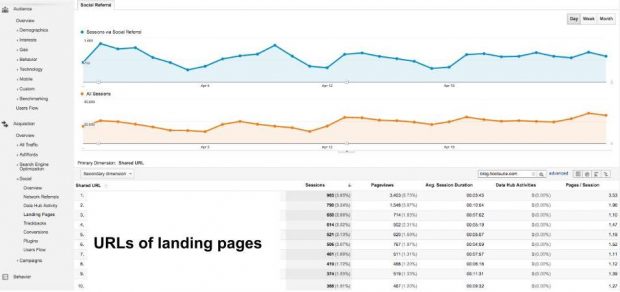
Here you can see engagement metrics for every individual URL. You’ll also be able to track the originating social network of that URL.
5. Trackbacks
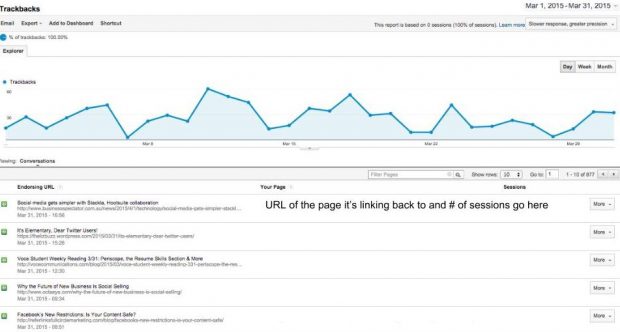
This report shows the sites that are linking to your content and the context in which it was linked. This data can help you replicate successful content and build solid relationships with the influencers who frequently link to your website.
6. Conversions
![]()
This report showcases the total number of conversions as well as the monetary value of each one. You’ll also be able to see the ones that occurred as a result of referrals for specific social networks.
This data is crucial for digital marketers. With it, you’ll be able to quantify the value and ROI of social media for your business.
7. Plugins
![]()
You know those social share buttons on your website? This report shows you whether or not those buttons are being clicked, how often they’re being clicked on, and for which content.
With this report, you’ll be able to learn the metrics and data that showcase which pieces of content on your site are being shared the most — and which social media networks they’re being shared on.
8. Users flow
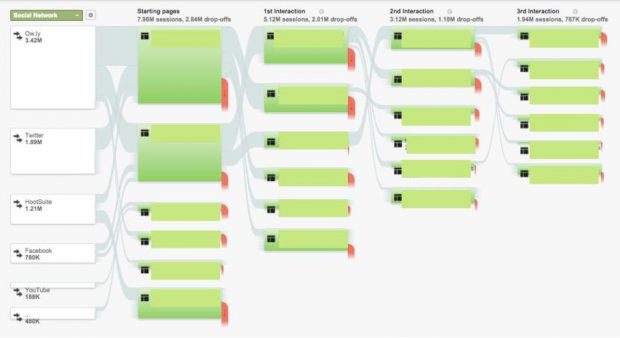
This report shows digital marketers a “graphical representation of the paths users took through your site from the source through the various pages and where along the paths they exited your site,” according to Google.
For example, if you’re running a campaign that promotes a specific product, you’ll be able to find whether users entered your site via a product page and if they continued to other parts of your site. You’ll also be able to take a look at the behaviors of users across different social media sites.
And that’s it. You’re ready to start tracking social media success and proving ROI with Google Analytics.
Drive more traffic to your website from social media using Hootsuite. From a single dashboard you can manage all your social media profiles and measure success. Try it for free today.
The post A 4-Step Guide To Tracking Social Media In Google Analytics appeared first on Hootsuite Social Media Management.