43 Social Media Advertising Statistics that Matter to Marketers in 2020
Trying to decide where to concentrate your social ad spend in 2020? We’ve collected the most recent social media advertising statistics—platform by precious platform—to get you started.
Social ads aren’t just for experts and consultants anymore, and almost no one is getting by on organic alone. Use these stats to get caught up on the state of paid social: it’s your first step towards better audience targeting, and bumping up that ROI.
Bonus: Download a free guide that shows you how to save time and money on your Facebook ads. Find out how to reach the right customers, lower your cost-per-click, and more.
Note: the following statistics come from early 2020 data and do not reflect changes arising from the global COVID-19 pandemic. We will continue to update this article as new data/projections become available.
General social media advertising statistics
1. Social ad spending is forecast to increase 20% to $43 billion USD in 2020
Technically, growth is slowing, according to eMarketer. Why? Probably a confluence of factors—cresting social saturation being one of them.
While this might mean less cash for Facebook shareholders, it’s probably good news for brands competing for ad views.
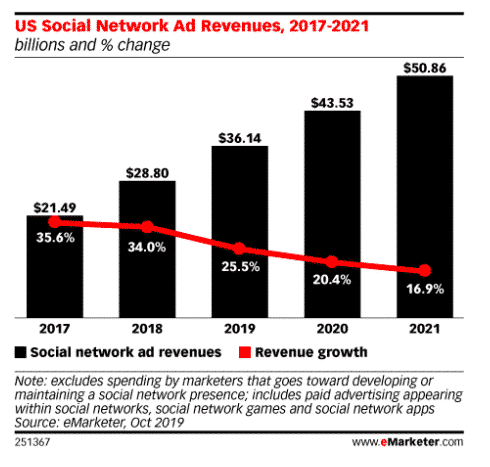
Source: eMarketer
2. As of late 2019, the worldwide average CPM is down 3%, year over year
Or, in regular human English: the average price that a brand pays for an ad to be seen by 1,000 people on social media was $5.35 USD in late 2019. This is down from $5.53 in late 2018.
So, despite the annual Q4 bump—when ad prices rise as everyone tries to attract those holiday shopper eyeballs—on average, social ad prices have been relatively stable since mid-2018.
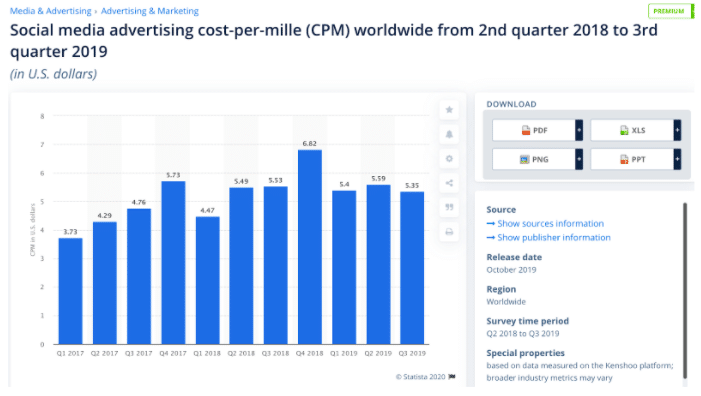
Source: Statista
3. Social ad impressions are up 20%, year over year
According to Statista, more people are seeing ads. Statista suggests that this is because of the rise of video and Story format ads, which generally do well with attracting impressions and engagement.
4. But average global social CTRs are down 30%, year over year
On the other hand, people are clicking less. Social clickthrough rates went from 2.6% in late 2018 to 2% in late 2019.
According to Statista, this primarily affects “traditional” forms of social advertising, but we’d say it affects everyone with an aim to convert.
5. 52% of all online brand discovery still happens in public social feeds
Yes, Mark Zuckerberg says “the future is private,” but public feeds aren’t in the grave by a long shot.
This number includes both paid and organic posts. Which is a good reminder that you still need those likes (or hearts, or thumbs) to maintain traction with the algorithm. (Any algorithm, all the algorithms, really.)
6. Weak social ads create negative emotional response in less than a second
By the time your viewer blinks, they’ve given your ad a Pass or a Fail.
In other words: don’t rely on cash to make up for quality. If you don’t want to be just another annoying brand ruining Instagram, you need high-quality copy, CTAs and visuals.
7. 72% of B2B marketers who use paid channels online use paid social
Over on the B2B side of things, marketers are generally convinced of social’s usefulness in their ad strategies.
Naturally, we’ll dive deeper on this in the LinkedIn section, further on.
8. 27% of internet users say they find new products and brands through paid social ads
Back to the B2C side: paid social ads are the #4 way people find new products, period. Like, in life, not just online. Social ads are the runner-up after word-of-mouth, TV ads, and search engines, in that order.
The percentage goes up for 16-24 year olds: 31% of them say they find new products and brands through paid social ads. (The chart in point #9 breaks this out further.)
Bonus stat: While we can’t source comparison data for the other platforms, please note that Snapchat says its users are 60% more likely to make an impulse purchase.
9. 13% of internet users say that a “buy” button would increase their likelihood of purchasing on social
This is not an impressive number. I mean, if you don’t have a buy button on your product posts, paid or organic, do take the time to add one. But it’s not a silver bullet. We will need to slay the werewolf of low conversions another way. (Werewolf conservationists don’t @ me.)
On the plus side, 23% say a brand with high engagement (i.e., likes, comments) is more compelling to buy from. One more reason to keep working that engagement.
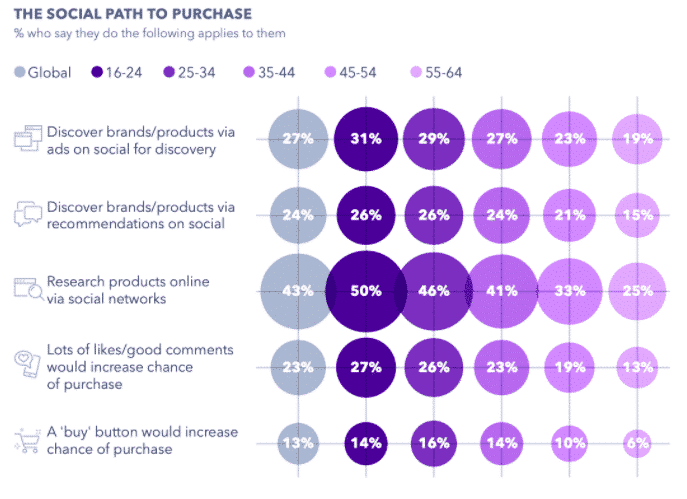 Source: GlobalWebIndex
If these stats have whetted your appetite for a primer on advertising on social, we have a complete guide right here.
Otherwise, read on for statistics for each unique, sparkling star of a social media platform.
Instagram ad statistics
10. 928.5 million people can be reached by ads on Instagram
That’s a high percentage of the platform’s 1 billion-plus monthly active users.
Note that 655.8 million of these users are between 13 and 34 years old.
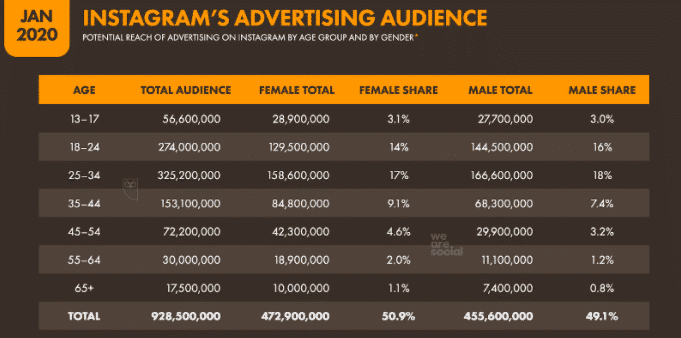
Source: Digital 2020
11. Instagram ads reach 15% of everyone over the age of 13, around the world
The platform’s highest penetration rates by country are Iceland, Kazakhstan and Brunei at 60%. Turkey and Cyprus are 57%, then Sweden at #6 is 56%.
Note that the U.S. (43%) and Canada (40%) don’t even make the top 10 by this measure.
12. Instagram’s ad reach is up 5.7%
Some context: as brands and agencies worry about the decline of organic reach, in June 2019, Instagram expanded their ad offerings to include paid placement on the Instagram Explore page. This effectively increased the volume of ads they can sell.
According to Hootsuite’s Digital 2020 report, Instagram showed this lift between Q3 and Q4 2019. (To compare, Facebook’s ad reach only went up 1% in this period.)
13. 92% of Instagram users say they’ve followed a brand, clicked on their website, or made a purchase after seeing a product/service on the platform
In other words, almost every single person on Instagram is interested in checking out new brands that appeal to them.
Meanwhile, 84% of Instagram users say they’re open to discovering small/local brands, or new brands and products.
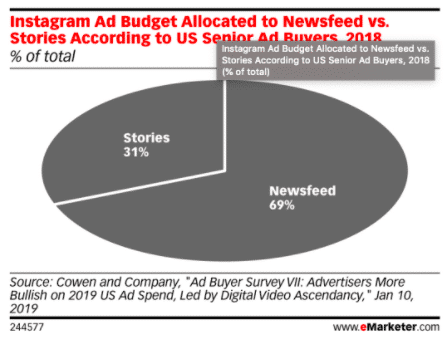
14. 31% of Instagram ad budgets go to Stories
And 96% of US marketers plan to continue using Stories ads in the future.
(No data yet on how much is going to those new Explore ads, but our eyes are peeled.)
Source: eMarketer
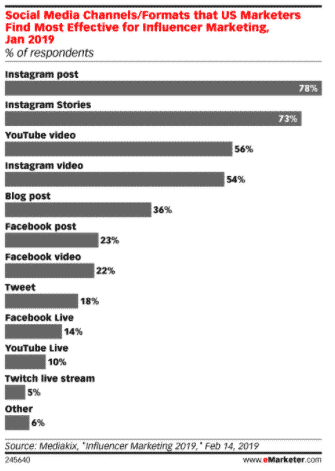
15. 69% of a brand’s influencer budget goes to Instagram creators, on average
In comparison, YouTube creators are at #2, snagging 11% of brands’ influencer budgets.
This lines up with the fact that Instagram posts, Stories and videos are 3 of the top 4 most effective formats for influencer marketing, according to a poll of marketers in the U.S.
 Source: eMarketer
16. Video is the most expensive Instagram influencer format for brands, who pay an average anywhere between $114 USD and $3136 USD per post
Feed posts are the middle ground, and Stories are the cheapest format to purchase. This makes sense, as video takes more skill and equipment to get right.
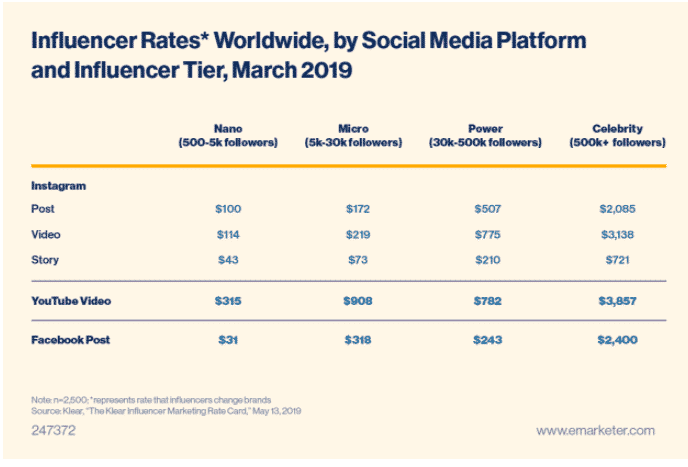
Source: eMarketer
Ready to run your own Instagram ads? Read our full guide here.
Facebook ad statistics
17. Facebook ads reach 1.95 billion of the platform’s 2.5 billion monthly users
According to Hootsuite’s Digital 2020 report, that’s 32% of the world’s population (over the age of 13). Facebook is, yes, still the biggest social platform on record.
Also note that around 1.21 billion of those people are between the ages of 13 and 34.
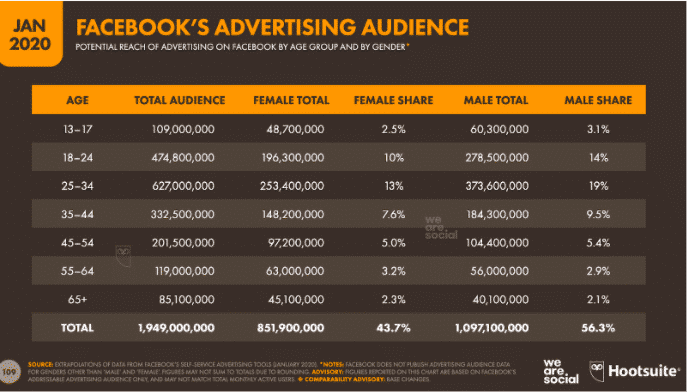
Source: Digital 2020
18. Facebook’s ad prices decreased 5% in Q4 2019, year over year
The company said in its Q4 2019 earnings call that this was primarily due to an increase in Stories ads, which are cheaper on average. (4 million advertisers are using Stories; twice as many as the year before.)
19. Facebook’s ad reach only grew 1% in Q4 2019.
Compare that to Instagram’s 5.7%. The platform has arguably hit its saturation point.
Bonus stat: Remember that 42% of users took a Facebook break in 2019.
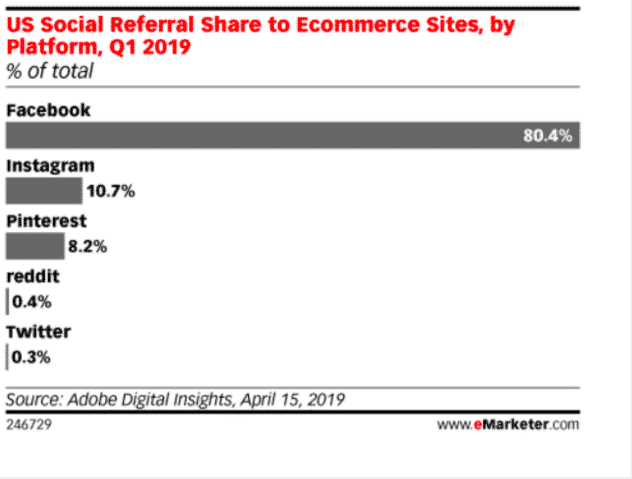
20. 80% of social referrals to ecommerce sites came from Facebook in Q1 2019
Despite potential saturation, turbulent PR, and headwinds from global privacy regulation, the platform’s scale is still delivering results for B2C advertisers. Instagram, by comparison, only drove 10.7% of traffic.
Source: eMarketer
21. 26.7% of Facebook Pages use paid media
Take into account the fact that this number includes all Pages: not just brands and businesses. (140 million businesses use Facebook, now, for the record.)
It’s just like my grandpa always said: organic reach is great, if you can get it.
Which brings us to our next point.
22. The average organic reach for a Facebook post is 5.17% of a Page’s likes, while the average paid reach is 28.1% of total reach
These benchmarks will be helpful whether you’re reviewing an individual ad’s performance or looking at your Facebook analytics as a whole.
23. Worldwide, the average Facebook user has clicked 12 ads in the last 30 days
That number doubles in Romania and Israel, but halves in Japan and India. Americans click 18 ads a month; Canadians 15.
Bonus: Download a free guide that shows you how to save time and money on your Facebook ads. Find out how to reach the right customers, lower your cost-per-click, and more.
Get the free guide right now!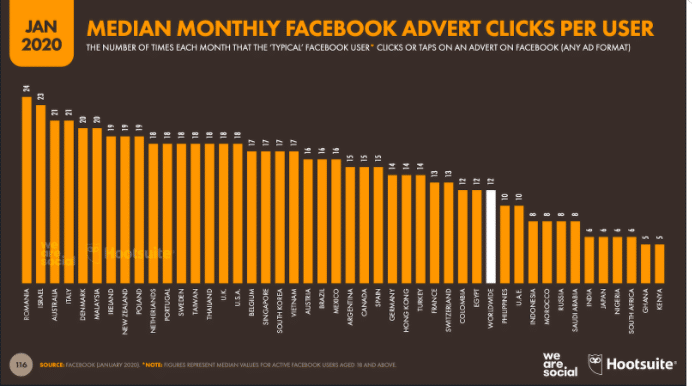
Source: Digital 2020
24. Split testing ads improves cost-per-acquisition by 72%, according to Facebook
In other words: testing means you learn more about what your audience likes, while your ads get cheaper.
So, why are marketers not A/B testing every ad they run in order to lower costs and bump up ROI? (Because we’re already overworked, obvi.)
No shame if this “extra” step is still on your to-do list: but let me just slip your our guide to split-testing social media ads.
Twitter ad statistics
25. Twitter shows ads to 152 million “monetizable users” every day
That’s a 21% lift year over year.
If this number seems small compared to the other platforms, note that Twitter recently began measuring its user base differently (daily, not monthly; and only the monetizable ones) to give a clearer picture to advertisers.
Also note that the platform generally punches above its weight: 92% of Americans know what Twitter is, even if they don’t use it. (Read more Twitter stats here.)
26. While 80% of Twitter’s users are international, only around 43% of the platform’s revenue comes from non-U.S. markets
Just want to point out here that if your brand’s target audience is not U.S.-based, Twitter might be a less saturated feed to advertise in.
27. Ad engagements increased 29% in Q4 2019
Twitter says this number was because of “increased impressions driven by audience growth and improved clickthrough rates.” The platform points to improvements they’ve made in ad targeting and relevance
28. Twitter’s cost-per-engagement dropped 13% in Q4 2019
This is good news for brands. Twitter blames video for this price drop, because video ads generally have lower CPE.
29. Twitter users spend 26% more time viewing ads than users on other platforms
And 90% of people on Twitter read the copy, which is higher than any other social platform.
Check out our guide to Twitter ad strategy here.
30. Promoted tweets with video have a 50% lower cost-per-engagement
Video also earns 10x more engagement in general. Tweets with video are 6x more likely to be retweeted than tweets with a photo.
Bonus stat: Tweets with hashtags get 100% more engagement. Though that starts to diminish if you use more than one or two hashtags.
Snapchat ad statistics
31. Snapchat has 218 million daily active users as of Q4 2019
That’s a 17% increase over 2019. According to Hootsuite’s calculations in Digital 2020, the platform’s monetizable users make up 6.3% of the global population over the age of 13.
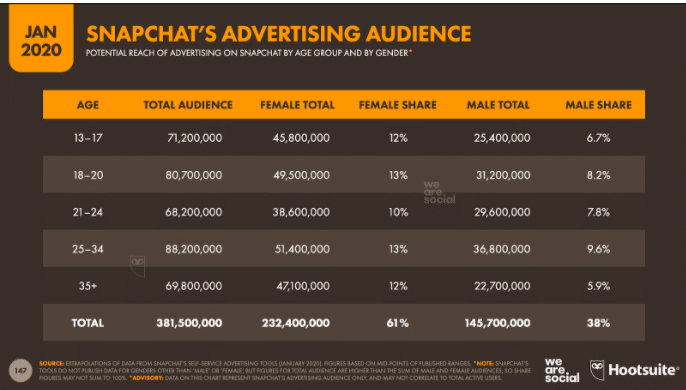
32. 82% of Snapchat’s advertising audience is 34 or younger
Snapchat’s youthful reputation continues. Users are also more likely to identify as female.
(If you like, you can dig deeper into Snapchat over at our fresh new list of 2020 social media statistics.)
Source: Digital 2020
33. Snapchat’s advertising revenue is forecast to be about 2 billion USD in 2020
Compare that to Facebook, which made 20 billion USD in the last quarter of 2019 alone. This is a niche platform with none of the scale (but also none of the saturation) of the major platforms.
34. Snapchat ads are 7x more efficient than TV ads at reaching Gen Z
Also note that, according to the same Neilsen study, 72% of Snapchat ad viewers weren’t even reachable by TV ads.
Bonus stat: 38% of Snapchat users aren’t on Instagram.
If your target audience is Gen Z or younger, we have a very helpful guide to Snapchat ads for you. [contenupgrade variant=popup]
LinkedIn ad statistics
35. LinkedIn ads reach 12% of the world’s population, and 62% of the American population
According to the most recent LinkedIn statistics, the platform is growing at a clip with 675 million users worldwide.
In America, according to Pew, the more money a person makes and the more education they have, the more likely they are to use the platform.
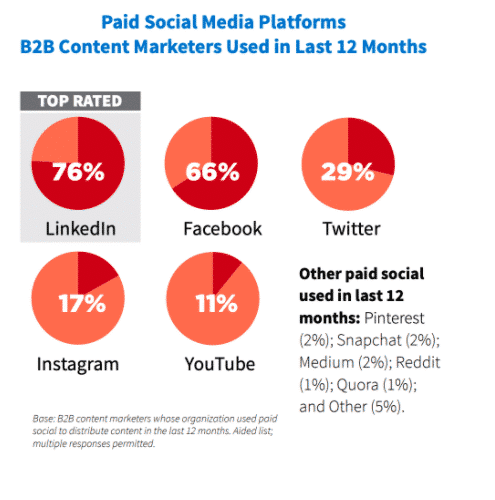
36. LinkedIn is the top paid (and organic) channel for B2B content marketers
LinkedIn may have started as a glorified CV site, but in recent years it has arguably cornered the B2B content marketing angle.
A key advantage here is that the LinkedIn algorithm actively supports brands (rather than downranking them like some algorithms we could name.)
Source: Content Marketing Institute
37. 89% of B2B marketers use LinkedIn for lead generation
Because LinkedIn’s advertising can target users by industry and job title, it’s particularly useful in generating leads, for both marketing and sales folks.
Bonus stat: And cost per lead on LinkedIn is 28% lower than on Google AdWords, making it more attractive.
38. Sponsored InMail has a 52% open rate, on average
Compare that to your average branded email’s open rate, which is 21.3%. If your mid-funnel marketing strategy involves getting your value proposition in front of the right eyes, sponsored InMail could be an interesting choice.
39. LinkedIn is the top platform for brand safety
In the past few years, making sure that your ads aren’t showing up beside polarized political misinformation or pictures of suffering koalas has become a strategic concern for almost every brand.
In a survey of advertising decision-makers, Linked scored a +45 on brand safety. Every other social platform was in the negative double-digits.
Ready for tactics and tips? Get them in our complete guide to LinkedIn ads.
YouTube ad statistics
40. YouTube brought in $15 billion USD in ad revenue in 2019
Last year was the first time parent company Alphabet broke out YouTube’s ad revenue from Google and other properties. (For those who are curious: those 15 Bees were a measly 9% of the behemoth’s total revenue for 2019.)
41. 70% of YouTube views are on mobile, but TV screens are the fastest-growing screen segment
This stat matters to advertisers as much as content creators. According to YouTube, watching on smart TVs, Apple TV, Roku and game consoles is up 39%.
If your YouTube ads are already optimized for mobile, you may soon be asking your video team to optimize for an 80-inch flatscreen with surround sound, as well.
For more YouTube ad strategies, read our guide.
42. YouTube Preferred ads lift recall by 112% and purchase intent by 53%
YouTube “Preferred Ads” only run on the top 5% of YouTube channels, so these are not your average stats. However, if you have the budget, these might be akin to the Super Bowl of YouTube.
43. Less than 1% of watchtime on YouTube is spent with borderline content
YouTube’s brand safety problem was among the worst of the platforms over the past few years. In December 2019 YouTube made a point of publicizing that their algorithm updates at the start of that year had resulted in a 70% drop in time spent watching harmful content.
Take Hootsuite Academy’s advance social advertising course and learn the tactics and best practices to create high-performing ad campaigns.
The post 43 Social Media Advertising Statistics that Matter to Marketers in 2020 appeared first on Hootsuite Social Media Management.