41 Facebook Stats That Matter to Marketers in 2019
Here’s the most impressive Facebook statistic out there: 2.23 billion people log in to the platform every month.
It’s a safe bet that your audience is using Facebook—and that your competitors are using it too.
But things get complicated when it comes to staying on top of the trends (not to mention algorithm changes). Make sure your Facebook strategy is as effective as it should be.
These 2019 Facebook stats for business will tell you what’s normal, and what’s next.
Bonus: Download a free guide that teaches you how to turn Facebook traffic into sales in four simple steps using Hootsuite.
Table of contents
General Facebook stats
Facebook user stats
Facebook usage stats
Facebook stats for business
Facebook advertising stats
Facebook video stats
General Facebook stats
Facebook is still the world’s biggest social media platform, but given recent scandals, the behemoth has been making course corrections. With its renewed focus on meaningful interactions between users, what are the numbers showing?
1. Facebook.com just dropped to the world’s third most-visited website
According to both Alexa and SimilarWeb, YouTube just replaced Facebook as the second-most popular website, globally. (After, of course, Google.)
However, a decline in Facebook’s website visits isn’t that surprising, given the broader shift towards mobile, and mobile apps in particular. Facebook is still the world’s most popular search term.
2. Facebook Messenger is the top mobile app by number of downloads
And the main Facebook app is second on the list. The dominance of mobile means marketers need to plan for mobile-first content.
(In case you were wondering: WhatsApp is third and Instagram is fifth.)
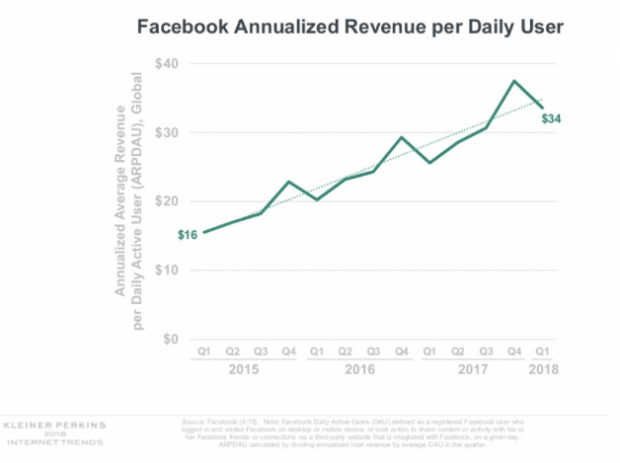
3. Facebook’s revenue per user has doubled in 3 years
Facebook’s focus on meaningful connection has driven rising user engagement, which in turn drives monetization for the platform.
What does that look like in dollars? Facebook earned $13.2 billion in revenue in the first quarter of 2018, a 42 percent increase, year over year.
4. Facebook removed 583 million fake accounts in the first three months of 2018
The drive towards accountability is top of mind for the platform. Marketers need to be aware of new transparency standards, including the fact that any ads a Page runs are now easily visible to users.
Weeding out the scammy, spammy and fake should mean more room for authentic and relevant brands.
Facebook user stats
Who’s using Facebook? The short answer is: almost everyone. However, it pays to keep an eye on the platform’s shifting popularity among demographics.
5. 68% of Americans use Facebook
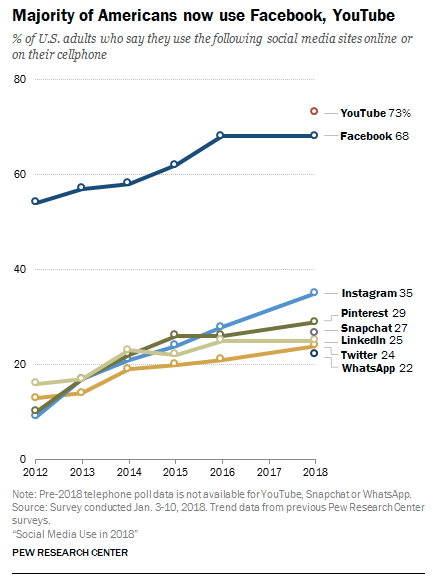
Facebook is the top choice for reaching the broadest audience. Compare that to the 35 percent of Americans using Instagram, 29 percent using Pinterest, and 24 percent using Twitter.
Global penetration, meanwhile, is at 22.9 percent, and growing.
6. Only half of American teens use Facebook
That’s a notable drop from three years ago, when the Pew Research Center’s previous survey reported that 71 percent of American teens were using Facebook. The top three platforms for teens are now YouTube, Instagram and Snapchat.
Note that teens from lower-income households are more likely to use Facebook than their wealthier peers. And globally, only seven percent of Facebook users are aged 13 to 17.
7. 35% of Facebook’s ad audience is under 25
Don’t believe the rumours that Facebook isn’t cool.
Ok, we can’t speak to its coolness. However, the numbers show that young adults are definitely still using it. And a full 30 percent of its ad audience is aged 25 through 34.
8. The number of American Facebook users aged 65+ has doubled to 41%
In 2012, only 20 percent of Americans in that age bracket used Facebook.
9. Roughly 10 percent of Facebook users are American
With an advertising audience of 210 million users, America is the second-biggest population on Facebook after India (at 270 million).
Rounding out the top five: Brazil, Indonesia and Mexico.
There’s a whole wide world out there, so consider tapping into it.
10. 1.1 billion Facebook users speak English
That leaves the other half using the platform in over 100 other languages.
The second most popular language on Facebook is Spanish, at 310 million, followed by Indonesian at 170 million, and Arabic and Portuguese, at 150 million each.
Facebook usage stats
Usage metrics like frequency and length of visits to Facebook are important, as they speak to both the size of a potential audience as well as the amount of attention available for messaging.
That said, Facebook’s move towards improving user experience means that hard-to-measure intangibles like ‘trust’ and ‘meaning’ suddenly matter a lot more.
How is Facebook usage holding up in the age of transparency?
11. 66% of monthly Facebook users use it daily
Worldwide, 1.47 billion people log in daily. Meanwhile, 74 percent of American Facebook users visit daily, with just over half of those checking in multiple times per day. This kind of frequency speaks to the importance of a consistent posting schedule for your Facebook marketing strategy.
12. Americans spend 58 minutes per day on Facebook
This is according to SimilarWeb, who measured the time US Android users spend in apps. (Since 77 percent of global mobile users own Androids, while only 18.9 percent use Apple, this data seems relevant.) Second place for app usage went to Instagram, at 53 minutes.
This seems to be an increase from the data Facebook itself released in 2016, saying that users averaged 50 minutes per day in Instagram, Messenger and Facebook combined.
13. Each visit to Facebook lasts 10 or 12 minutes
According to Alexa and SimilarWeb’s global website ranking, users check in for relatively short amounts of time. You only have a few seconds to grab attention while they scroll.
On the plus side, more visits means more space in the newsfeed for ads.
14. 88% of Facebook users are accessing via mobile device
And 95 percent of Facebook visits are made on smartphones and tablets. Only 31.8 percent of visits are made on desktops or laptops.
Optimizing your content for mobile is non-negotiable.
15. 200 million people are members of meaningful Facebook Groups
This number has doubled in the last year, supporting Facebook’s five-year goal of 1 billion meaningful Group members. (There are already 1 billion Group members, but ‘meaningful’ Groups are communities that become a key part of a user’s experience.)
Now that Facebook’s algorithm prioritizes meaningful interactions between friends, family and communities (over brands, for instance), Groups are an opportunity to gather like-minded individuals together. Check out our guide to using Facebook Groups for business to get get tips on how to use Facebook’s own priorities to your advantage.
16. 43 percent of Americans get their news from Facebook
This makes Facebook the number one social media platform for news, with second-place YouTube trailing at 21 percent.
However, 57 percent of Americans who get their news on social media say they believe that news is largely inaccurate. Even among the people who prefer to get their news on social media, 42 percent say that news is, again, largely inaccurate.
Whether you’re a publishing brand or a content marketer, consider your reputation as an authority in your field. Developing your audience’s confidence on this platform will help you stand out from the crowd.
Facebook stats for business
Here are some benchmarks to give you an overview of how brands are using Facebook.
17. Facebook has 80 million small- and medium-sized business Pages
That’s a 23 percent increase year over year. Of these businesses, 6 million advertise on Facebook.
18. 78% of American consumers have discovered retail products to buy on Facebook
Facebook’s importance as a discovery platform—where users can browse, research, and get inspired—outranks both Instagram and Pinterest, who’ve inspired 59 percent of American consumers each.
19. Facebook is the top platform for both B2B and B2C businesses
98 percent of the B2C businesses surveyed in Hootsuite’s 2018 Global Barometer Report use Facebook, while 89 percent of the B2B companies do. (Mixed audience businesses report 97 percent buy-in.)
Compare that to business-oriented LinkedIn, where B2C usage is 46 percent, and B2B is 86 percent. Because the lines between professional and personal use are more fluid on Facebook than other channels, the platform can be effective for both audiences.
Here’s proof: 54 percent of B2B marketers say that Facebook is their most important platform (an increase from 43 percent last year). This cuts into LinkedIn’s popularity, which fell from 37 to 28 percent.
20. 30% of marketers think Facebook offers the highest digital ad ROI
While Google Search came out on top overall, with 48 percent of respondents’ votes, Facebook trounced other social media platforms. Instagram and YouTube came in with four percent of the votes, while Twitter took two percent.
If you’re interested in learning more about how to define context, choose the best metrics, and come up with useful insights that prove the value of your work, take a look at our guide to Social Media ROI.
21. 0.15% is the average monthly change in Page likes
While more Page likes theoretically mean a bigger audience and increased reach, Facebook’s dominance as a social channel has led to a new problem: saturation.
Whether you have a million followers or a hundred, don’t expect huge fluctuations here (unless your Page is brand new, in which case check out our tips for optimizing your Facebook Business Page).
22. Only 31% of businesses use Facebook Messenger
Speaking of saturation, how about sidestepping it? Facebook has been actively building out the business ecosystem around messaging apps like Messenger and Whatsapp. There’s opportunity here to reach your audience without fighting through the newsfeed noise.
Messenger has 1.3 billion users sending 8 billion messages between businesses and people every month. Not to mention around 300,000 chatbots. This means it’s definitely time to consider a Facebook Messenger bot strategy.
Facebook advertising stats
Whether you pay for ads or focus on growing your reach organically, Facebook advertising affects your marketing strategy. Here are some statistics that will help you understand the current state of affairs in this constantly changing field.
23. The average engagement rate for a post is 3.91%
Reactions and likes are good, but shares and comments are better, according to Facebook’s algorithm. Engagement is the best way to drive reach, and posts with higher engagement are cheaper to promote, so keep this benchmark in mind as you evaluate your posts’ success.
24. The average organic reach for a Facebook post is 6.4% of a Page’s likes
Organic reach on Facebook has been declining since 2014. While there are ways to increase a post’s reach without paying, promoting content via paid ads is also an option.
Overall reach, including both organic and paid, is at 8.1 percent.
25. The average price per ad increased 17% in Q2 2018
According to Forrester’s analysis, ad price growth can’t continue indefinitely. Facebook’s been warning of a revenue deceleration since early 2017. While investors may be spooked, marketers can use this number as a barometer for their social ad spending.
26. Simultaneously, the number of ad impressions increased 21%
This increase was driven primarily by newsfeed ads on Instagram and Facebook.
As organic reach declines and ad prices continue to increase, making sure your ads are relevant and engaging for your audience is more and more important. Our guide to optimizing your Facebook ad spend will help you test, measure and execute effective ads.
27. 24.2% of Facebook Pages are using paid media
Paid ads have several features that organic posts don’t, including precise audience targeting that can guide on-the-fence customers further down your sales funnel, or identify quality leads.
The number of paying Pages is increasing, though, pointing to increased competition for ad space, especially in newsfeed.
28. An average Facebook user clicks on 8 ads per month
This number goes up to 10 for women and drops to seven for men.
However, this is an overall decline from early 2018, when Facebook was reporting a median of 10 ad clicks per month per user. But this isn’t necessarily bad news: not all ads require a click to be effective.
Bonus: Download a free guide that teaches you how to turn Facebook traffic into sales in four simple steps using Hootsuite.
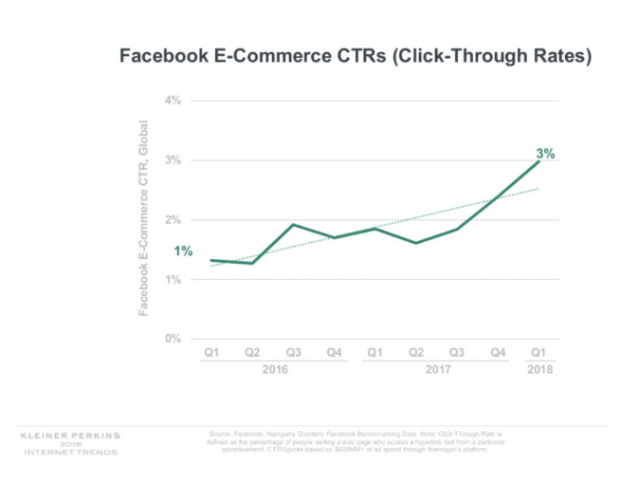
Get the free guide right now!29. E-commerce click-through rates have tripled in the last two years
On the plus side, Facebook users interested in buying are clicking on ads more and more. E-commerce-specific ad engagement has risen from one percent to three percent.
30. Facebook’s mobile ad revenue increased 50% year over year in June 2018
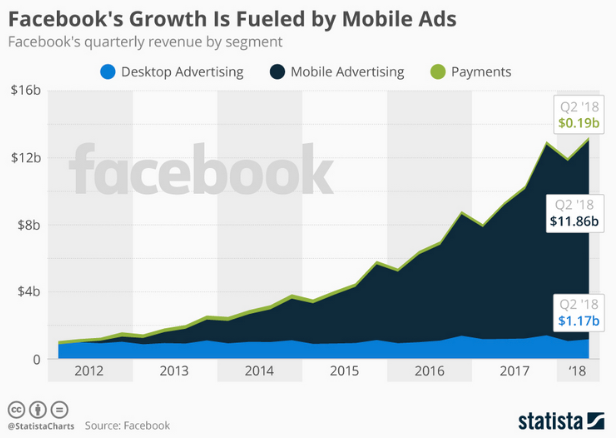
Marketers are targeting their ad spends on mobile, which makes sense, given that almost all users are accessing Facebook on their handheld devices.
Facebook video stats
Whether you’re using native, Live, Story or ad video—or all of the above—check out these stats to fine-tune your video strategy’s focus.
31. 71% of people have increased their online video viewing
That’s just in the last year. And 60 percent expect to watch more social video next year. Video’s been touted as the dominant form of online consumption for years now, yet it is still growing.
32. Facebook owns 24.5% of all digital video ad spending in 2018
Facebook (including Instagram) is forecasted to control nearly 87 percent of US social media video ad spending in 2018. That same amount translates to one quarter of all U.S. video ad spending.
It’s a crowded market, but as video ads grow (video is now 25 percent of all digital ad spending), Facebook continues to be the preferred channel.
33. Marketers spend 20 times as much on TV ads to reach around twice the audience as their Facebook videos
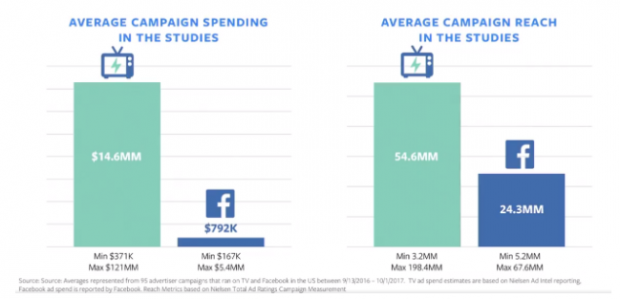
Facebook video is highly effective, compared to traditional channels. Average cost per reach on Facebook is significantly lower than TV, in particular.
34. Mobile-optimized Facebook video lifts brand awareness to 67% percent
As opposed to recycled TV video ads, which run around a 40 percent lift in brand awareness. As well, message association (that is: being able to match the message to the brand) doubles to 41 percent.
Creating video content specifically for mobile viewing is important. Marketers need to adjust ad length, capture attention in the first few seconds, and focus on full-screen vertical experiences. Here are the guidelines for the latest Facebook video specs.
35. 30% of mobile shoppers say video is the best medium for discovering new products
And millennials are 1.35 times more likely than boomers to feel that way. Video can and will help you feed your sales funnel.
36. Facebook users watch ads five times longer when they’re consuming video intentionally
People have different viewing habits depending on their viewing intentions, so a six-second ad isn’t always your best bet.
For instance, people using Facebook Watch are open to longer ads than people who are just browsing their newsfeed.
37. When watching Facebook video ads, people between 18-24 spend 75 percent of the attention that people age 65+ do
Given today’s attention spans, consider adjusting your video ad length to your target audience.
Take note that this may mean that view duration and completion rates aren’t always the best measure for an ad’s success. Audience demographics should be taken into account.
38. People gaze five times longer at video than at static posts on Facebook
Facebook’s user behavior studies show that video is inherently more interesting to audiences.
39. The average engagement rate for Facebook video posts is 6.01%
That’s a full two percentage higher than the average for all posts, meaning video is pulling further and further ahead. It’s also higher than photo posts (4.81 percent), link posts (3.36 percent) and status posts (2.21 percent)—all of which have declined in popularity.
40. 150 million people are using Facebook Stories
The disappearing-content feature is relatively new to Facebook, but Facebook is pushing it and so you can already buy ads there.
Given that there’s a much larger percentage of people using Instagram Stories (400 million out of 1 billion monthly active users), this is a familiar channel that is still un-saturated, with tons of room for growth.
Also remember that one-third of the most-viewed Instagram Stories are from businesses. Facebook Stories may well be similarly fruitful for marketers.
41. Facebook Live broadcast watch times quadrupled in one year
Here’s another channel that Facebook is prioritizing, meaning that early adopters can benefit from preferential treatment. Since Live videos standardly receive six times as many interactions as regular videos, they rank higher in the newsfeed.
Integrating Facebook Live video into your marketing strategy is becoming increasingly popular: one in five Facebook videos is a live broadcast.
Manage your Facebook presence alongside your other social media channels using Hootsuite. From a single dashboard you can schedule posts, share video, engage your audience, and measure the impact of your efforts. Try it free today.
The post 41 Facebook Stats That Matter to Marketers in 2019 appeared first on Hootsuite Social Media Management.