Snapchat Analytics: How to Measure Your Brand’s Efforts on the App
Why do Snapchat analytics matter? Because they allow you to prove the return on investment (ROI) of the platform by helping you:
- Gain insights about your audience
- See what content performs the best with your audience
- Gain a competitive edge in the market
- Unlock engagement strategies
- Discover key engagement times
With Snapchat’s built-in analytics tool, Snapchat Insights, you can track and optimize your Snapchat metrics including:
- Detailed look at story views. How many viewers saw your story over weeks, months, and years.
- Viewer demographics. Your viewers’ age, location, gender, and interests they have.
- Completion rates. How many viewers watch a Snapchat story until the very end.
Let’s take a look at the tool and break down how you can use it to learn more about your audience.
Table of contents
How to use Snapchat Insights
Other Snapchat analytics tools
8 key Snapchat metrics to track
Bonus: Download a free guide that reveals the steps to create custom Snapchat geofilters and lenses, plus tips on how to use them to promote your business.
How to use Snapchat Insights
Knowing how your Snapchat campaign is performing is crucial to any social media strategy. Luckily, with the Snapchat analytics tool, you’ll be able to determine the return on investment of the platform more easily than ever.
Note: Snapchat Insights is currently only offered to influencers and brands who are verified or have a large following. From the Snapchat website: “Snapchatters who are Official Stories or creators who have cultivated a large audience on Snapchat have access to Insights!”
If you want to start building your Snapchat following, don’t worry: Check out our complete guide to using Snapchat for business.
Once you have Snapchat Insights, it’s time to dive into your analytics, which brings us to…
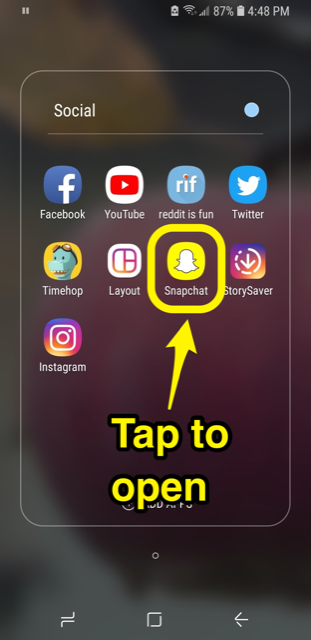
Step 1: Open the app
Go to the app on your phone and tap on the Snapchat icon to open it.
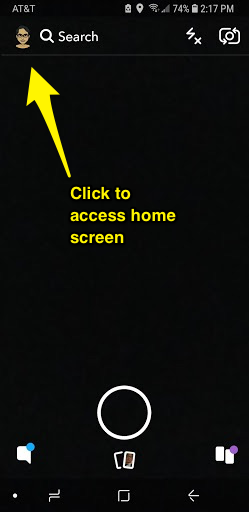
Step 2: Go to your home screen
In order to get to your Snapchat insights, you’ll need to get to your home screen first. Open the app and tap on your bitmoji on the top left hand corner.
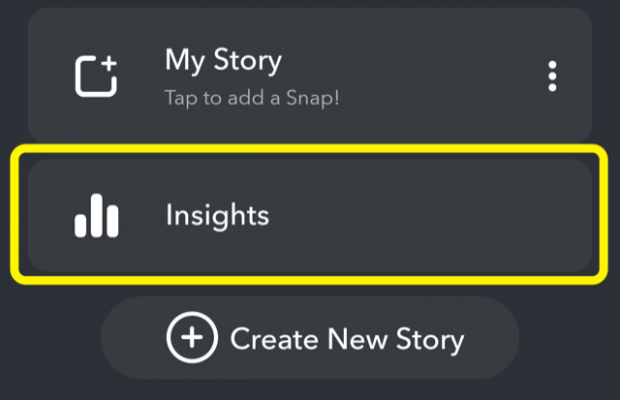
Step 3: Access Snapchat Insights
From your home screen, you’ll find a tab labeled “Insights” below “My Story.” Tap on your Insights tab to access your Snapchat analytics.
Note: If you can’t find the Snapchat Insights tab, make sure you have the most up-to-date version of the app on your phone. If it’s still not showing up, try uninstalling and reinstalling the app before restarting your phone completely.
Once you’re in, you’ll have access to all of your Snapchat Insights data—the first page of which will look like this:
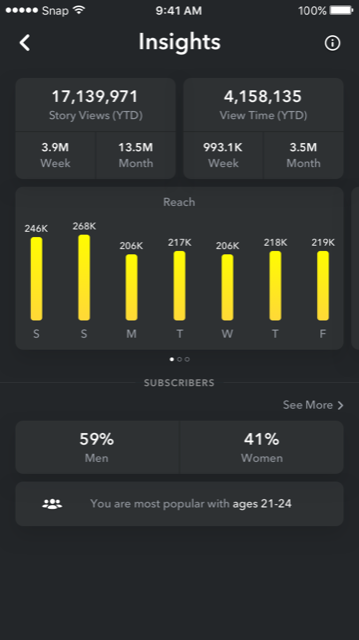 Image via Snapchat
Other Snapchat analytics tools
If you’re looking for another great way to look into your analytics besides Snapchat Insights, you’re in luck. There’s a host of great Snapchat analytics tools you should use to track your marketing campaigns.
The two we suggest: Snaplytics and Delmondo.
Let’s take a look at both now.
Snaplytics
Launched in 2015, Copenhagen-based Snaplytics has positioned itself as a fantastic Snapchat analytics tool.
Key metrics offered through Snaplytics include:
- Open rates
- Views
- Average number of screenshots per story
- Completion rate
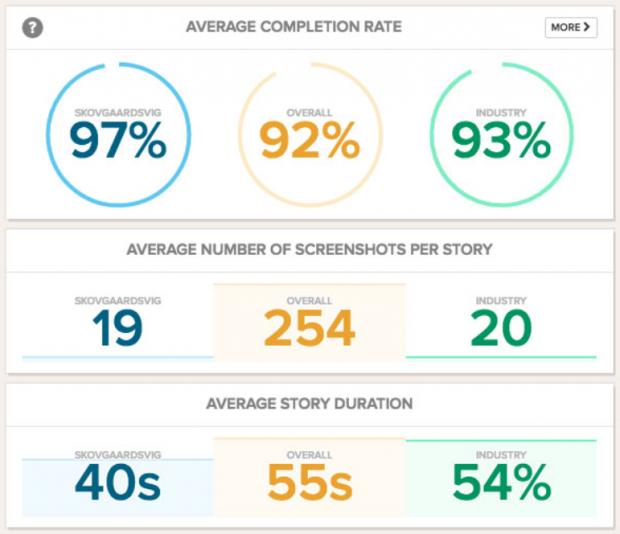 Image via Snaplytics
Delmondo
Delmondo is another great Snapchat tool to pack into your analytics belt. Used by big brands like McDonald’s and Spotify, Delmondo’s metrics pack a punch, especially with its daily automated data collection and long-term reporting.
Key features offered by Delmondo include:
- Basic metrics including unique views, impressions, completion rates, and screenshot rates
- Audience insights which provides detailed overviews of who’s watching your content
- Channel comparisons which provides channel comparison data to show how your Snapchat Stories stack up against your content on Facebook, Twitter, Instagram, and YouTube
8 key Snapchat metrics to track
Now that you know how to get to Snapchat Insights—as well as a few great third-party tools—it’s time to take a look at the key metrics you’ll want to track for your social media campaign.
They are:
1. Unique views
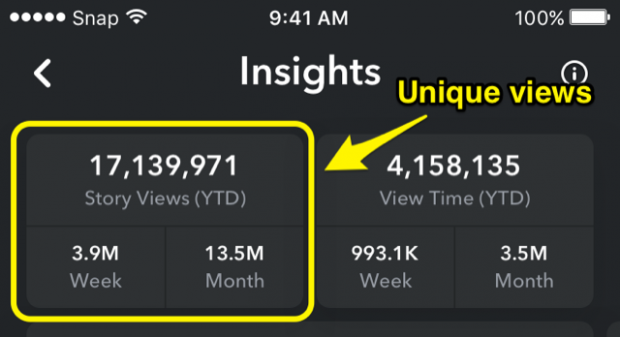
You can see how many total unique viewers saw your Snapchat story in the box labeled “Story Views (YTD).” This is the total number of people who opened the first video or image on your Snapchat story and looked at it for at least one second.
The viewer is only counted once. This means that the number you see reflects the total amount of users who saw your content, regardless of how many times they actually watched the story.
Below the box you’ll also find the total number of unique views you’ve netted for the week and month.
2. View time
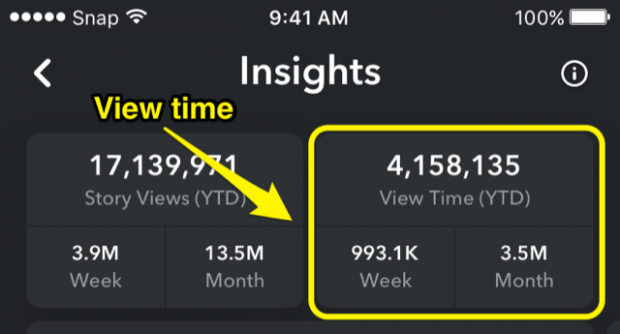
Your view time shows you how many minutes your viewers watched your Snapchat story. Like your story views, you can view the year-to-date information as well as the time in weeks and months.
This tells you how successful your content is at not only drawing people’s attention but keeping it too. If you ever see a dip in these numbers, you might want to consider changing the type of content you’re promoting.
If you want to take an even more nuanced look at your view times, swipe to the next window in the middle.
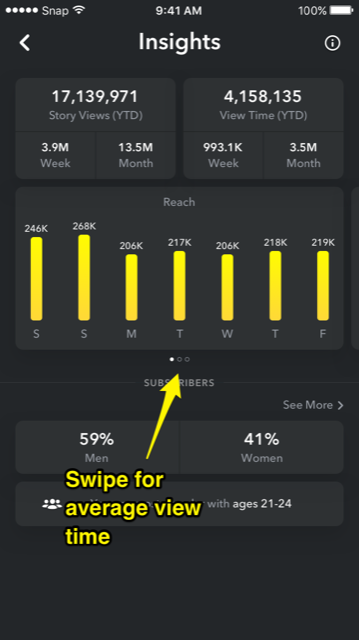
There you’ll be able to see the average view time for each day of the week. This will show you how long viewers watched your story before moving onto the next story on average.
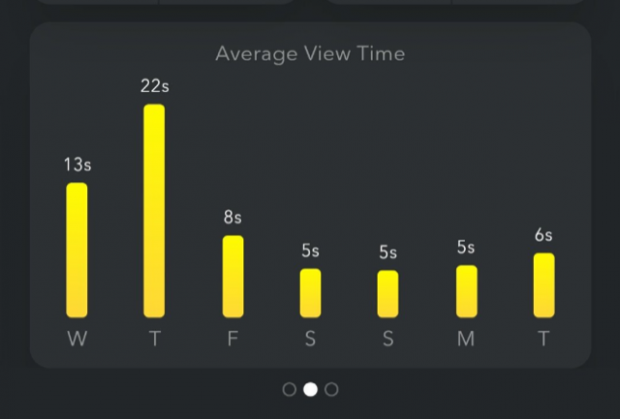
This data will tell you two things:
- Which day of the week is best for you to post on. For example, you might want to consider posting more frequently on Thursdays according to the data in the picture above and avoid the weekend.
- How long your story should be. If you notice your audience views your story around nine seconds on average (like the above example), you might want to keep your content around nine seconds.
Overall, the views will help you determine the type of content your audience wants to see and the length they want to see it.
3. Completion rate
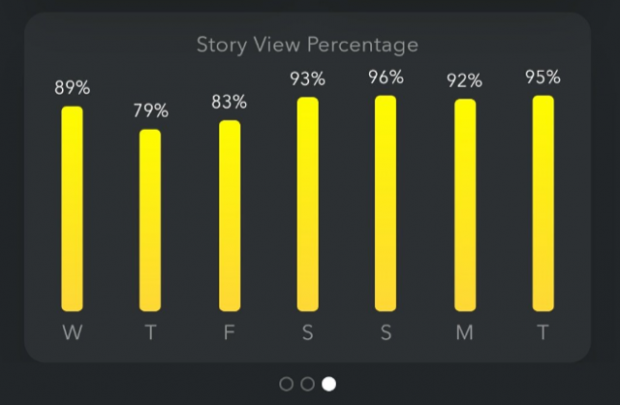
To view your completion rate, simply swipe to the final metrics page in the middle of the insights screen labeled “Story View Percentage.” There you’ll be able to see your completion rates for the entire week.
Like a website’s bounce rates, your completion rates will show you how many viewers watched the entire story from beginning to end. You’ll be able to determine whether or not your Snapchat story is resonating with your audience.
Before Snapchat Insights, influencers and brands had to divide the final view count by the first view count to determine the completion rate. Now you’ll be able to access your completion rate on your “Story View Percentage” page.
You want to keep these numbers close to 100 percent. If you find them dipping, this means that your audience isn’t engaged with your content enough to watch your entire Snapchat story. Consider shortening your content or changing the type of content you showcase.
4. Fall-off rate
Snapchat’s native analytics platform lacks in a few areas. For instance, you still cannot find the fall-off rate for your Snapchat Stories.
Your fall-off rate can give you incredibly powerful insights into the engagement strength of your Snapchat presence by showing exactly where viewers stopped watching your story.
In lieu of showing you where the fall-off rate is on Snapchat Insights, influencers are going to have to do some good ol’ fashioned back-of-the-napkin math. Luckily, it’s dead simple.
To calculate, find the difference in views from one Snap to the next, divide the difference by the views on the first Snap, and multiply by 100. This allows you to pinpoint exactly where your viewers begin to drop off your story.
For example, you have a story with two photos. The first photo has 100 views, the second has 80.
100 – 80 = 20
And then:
20 / 100 = .20
Finally:
.20 x 100 = 20%
Voila! You have your fall-off rate of 20 percent.
Going forward, you can then use these insights to better optimize the structure of your Stories for better engagement.
5. Screenshots
When you’re on Facebook, Instagram, or Twitter, your engagement is tracked via likes and comments. However, on Snapchat, your engagement is tracked via screenshots.
This shows you how many people took a screenshot of your Snapchat content.
Bonus: Download a free guide that reveals the steps to create custom Snapchat geofilters and lenses, plus tips on how to use them to promote your business.
Get the free guide right now!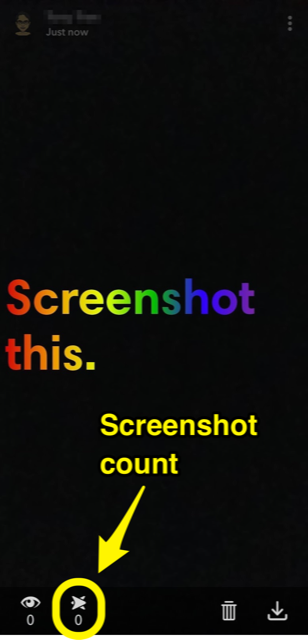
Screenshots can also help encourage engagement too. They’re also helpful to measure the success of your Snapchat marketing campaign.
For example, Taco Bell invited their followers to screenshot a Valentine’s Day card from their brand Story and share it with friends for their Valentine’s Day Snapchat campaign.
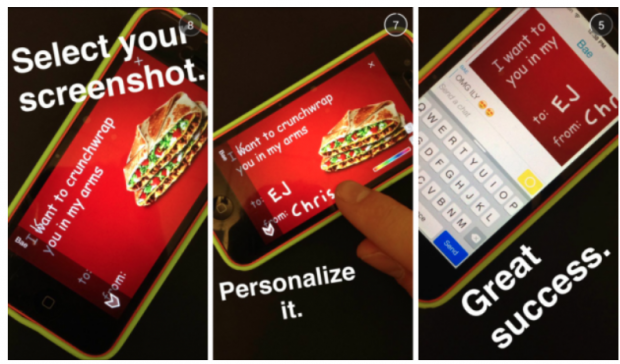 Image via Marketing Land
Keep track of your screenshots to learn which content types (e.g. photos, videos, filtered images) resonate the most with your audience. Also be aware of who is screenshotting your Snaps the most. They could end up being some of your biggest brand promoters.
6. Demographics
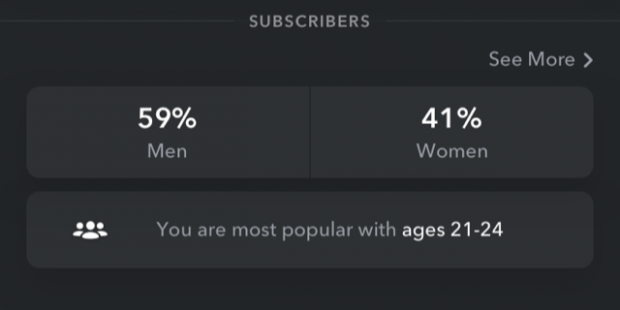
With Snapchat Insights, you can now take a look at the demographics of your followers too. This can help you determine the type of content you choose to promote and who you want to target.
From the Insights page, you can find the percentage of men and women who watched your story at the bottom. You’ll also find the age range of your viewers as well.
You can explore your demographics even further by tapping the “See More” button, which will take you to this page:
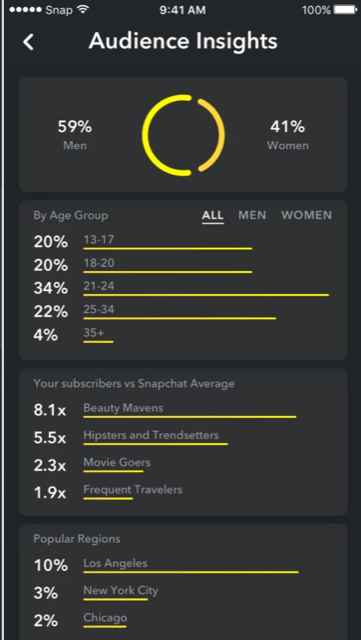
From here, you’ll be able to take a very detailed look inside of the age, interests, and locations of your viewers. You can even take it even further and look at that demographic information between men and women.
This data can be crucial to help you determine everything from the photos you share even to the products you release.
7. Number of followers
This one is straightforward. Your Snapchat followers are the ones following you and (hopefully) engaging with your content.
What isn’t straightforward, though, is the exact number of followers you have. Snapchat currently uses a scoring system in lieu of a precise follower count.
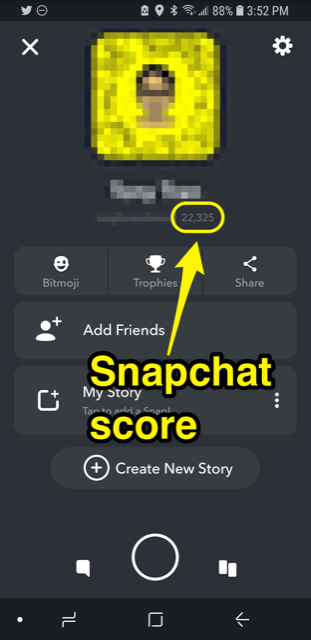
This score represents the sum of all the messages you send and receive. However, there is a handy rule-of-thumb that allows you to roughly calculate your followers: Take the highest number of views you’ve received on a Snapchat Story and multiply it by 1.5.
This should give you a rough estimate of how many followers you have on Snapchat. Knowing the amount of followers you have will key you in on how aware people are of your brand, as well as whether or not your Snapchat campaigns are worthwhile in the first place.
8. Geofilter analytics
Geofilters are one of the coolest features on Snapchat. They allow users to add images, illustrations, custom stamps, and branding to photos and videos.
For brands, geofilters are fun and powerful ways to encourage engagement in a product or event.
Check out a few of these awesome branded geofilters:
 Image via Pinterest
 Image via Tumblr
 Image via CNBC
Snapchat geofilters can even be tracked for effectiveness. Here’s how you do it:
- Log into Snapchat on the web
- Click on your name in the top right corner of Snapchat
- Click My Geofilters
- Select the Geofilter
- Scroll down to see your metrics, and voila!
Hungry to step up your Snapchat game even further? Then check out our post on Snapchat hacks, tricks, and features you probably didn’t know about.
Bonus: Download a free guide that reveals the steps to create custom Snapchat geofilters and lenses, plus tips on how to use them to promote your business.
The post Snapchat Analytics: How to Measure Your Brand’s Efforts on the App appeared first on Hootsuite Social Media Management.