Spying On Google: 5 Ways to Use Log File Analysis To Reveal Invaluable SEO Insights
Posted by faisal-anderson
Log File Analysis should be a part of every SEO pro’s tool belt, but most SEOs have never conducted one. Which means most SEOs are missing out on unique and invaluable insights that regular crawling tools just can’t produce.
Let’s demystify Log File Analysis so it’s not so intimidating. If you’re interested in the wonderful world of log files and what they can bring to your site audits, this guide is definitely for you.
What are Log Files?
Log Files are files containing detailed logs on who and what is making requests to your website server. Every time a bot makes a request to your site, data (such as the time, date IP address, user agent, etc.) is stored in this log. This valuable data allows any SEO to find out what Googlebot and other crawlers are doing on your site. Unlike regular crawlings, such as with the Screaming Frog SEO Spider, this is real-world data — not an estimation of how your site is being crawled. It is an exact overview of how your site is being crawled.
Having this accurate data can help you identify areas of crawl budget waste, easily find access errors, understand how your SEO efforts are affecting crawling and much, much more. The best part is that, in most cases, you can do this with simple spreadsheet software.
In this guide, we will be focussing on Excel to perform Log File Analysis, but I’ll also discuss other tools such as Screaming Frog’s less well-known Log File Analyser which can just make the job a bit easier and faster by helping you manage larger data sets.
Note: owning any software other than Excel is not a requirement to follow this guide or get your hands dirty with Log Files.
How to Open Log Files
Rename .log to .csv
When you get a log file with a .log extension, it is really as easy as renaming the file extension .csv and opening the file in spreadsheet software. Remember to set your operating system to show file extensions if you want to edit these.
How to open split log files
Log files can come in either one big log or multiple files, depending on the server configuration of your site. Some servers will use server load balancing to distribute traffic across a pool or farm of servers, causing log files to be split up. The good news is that it’s really easy to combine, and you can use one of these three methods to combine them and then open them as normal:
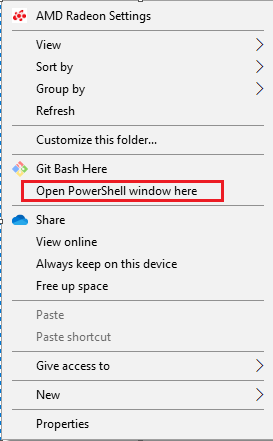
- Use the command line in Windows by Shift + right-clicking in the folder containing your log files and selecting “Run Powershell from here”
Then run the following command:
copy *.log mylogfiles.csv
You can now open mylogfile.csv and it will contain all your log data.
Or if you are a Mac user, first use the cd command to go to the directory of your log files:
cd Documents/MyLogFiles/
Then, use the cat or concatenate command to join up your files:
cat *.log > mylogfiles.csv
2) Using the free tool, Log File Merge, combine all the log files and then edit the file extension to .csv and open as normal.
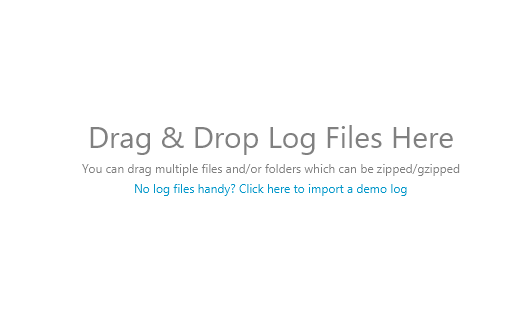
3) Open the log files with the Screaming Frog Log File Analyser, which is as simple as dragging and dropping the log files:
Splitting Strings
(Please note: This step isn’t required if you are using Screaming Frog’s Log File Analyser)
Once you have your log file open, you’re going to need to split the cumbersome text in each cell into columns for easier sorting later.
Excel’s Text to Column function comes in handy here, and is as easy as selecting all the filled cells (Ctrl / Cmd + A) and going to Excel > Data > Text to Columns and selecting the “Delimited” option, and the delimiter being a Spacecharacter.
Once you’ve separated this out, you may also want to sort by time and date — you can do so in the Time and Date stamp column, commonly separating the data with the “:” colon delimiter.
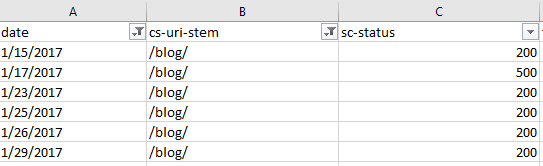
Your file should look similar to the one below:
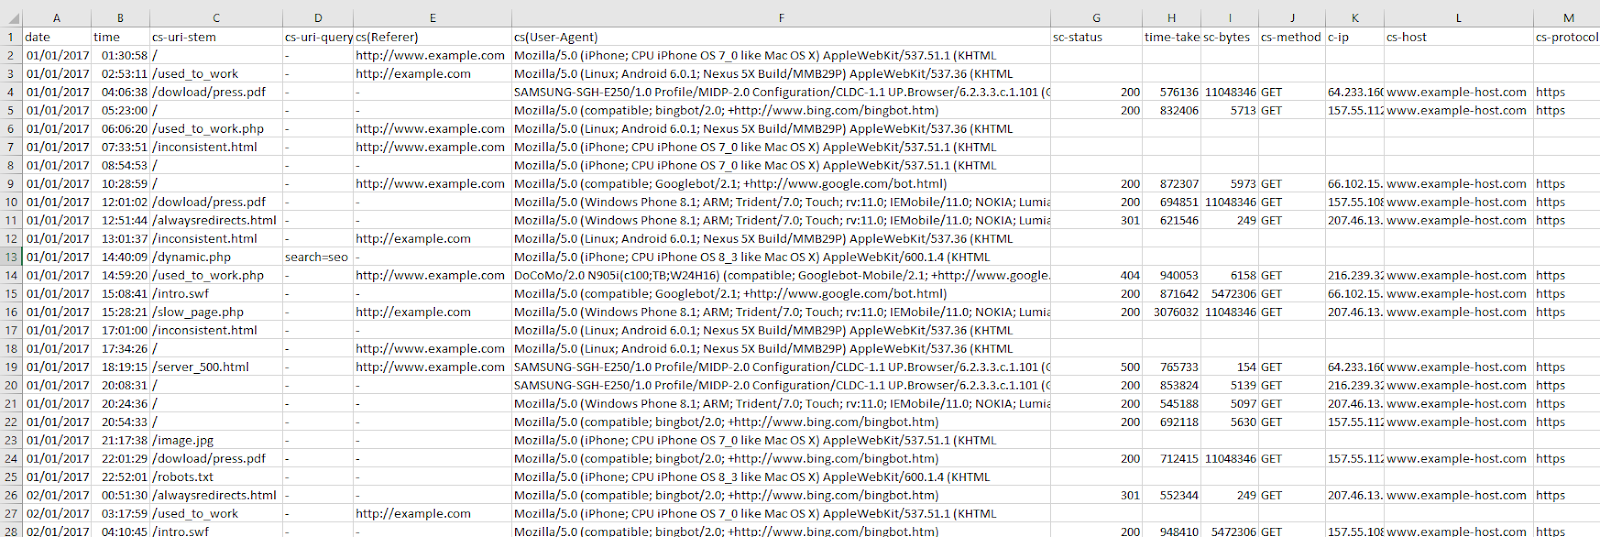
As mentioned before, don’t worry if your log file doesn’t look exactly the same — different log files have different formats. As long as you have the basic data there (time and date, URL, user-agent, etc.) you’re good to go!
Understanding Log Files
Now that your log files are ready for analysis, we can dive in and start to understand our data. There are many formats that log files can take with multiple different data points, but they generally include the following:
- Server IP
- Date and time
- Server request method (e.g. GET / POST)
- Requested URL
- HTTP status code
- User-agent
More details on the common formats can be found below if you’re interested in the nitty gritty details:
- WC3
- Apache and NGINX
- Amazon Elastic Load Balancing
- HA Proxy
- JSON
How to quickly reveal crawl budget waste
As a quick recap, Crawl Budget is the number of pages a search engine crawls upon every visit of your site. Numerous factors affect crawl budget, including link equity or domain authority, site speed, and more. With Log File Analysis, we will be able to see what sort of crawl budget your website has and where there are problems causing crawl budget to be wasted.
Ideally, we want to give crawlers the most efficient crawling experience possible. Crawling shouldn’t be wasted on low-value pages and URLs, and priority pages (product pages for example) shouldn’t have slower indexation and crawl rates because a website has so many dead weight pages. The name of the game is crawl budget conservation, and with good crawl budget conversion comes better organic search performance.
See crawled URLs by user agent
Seeing how frequently URLs of the site are being crawled can quickly reveal where search engines are putting their time into crawling.
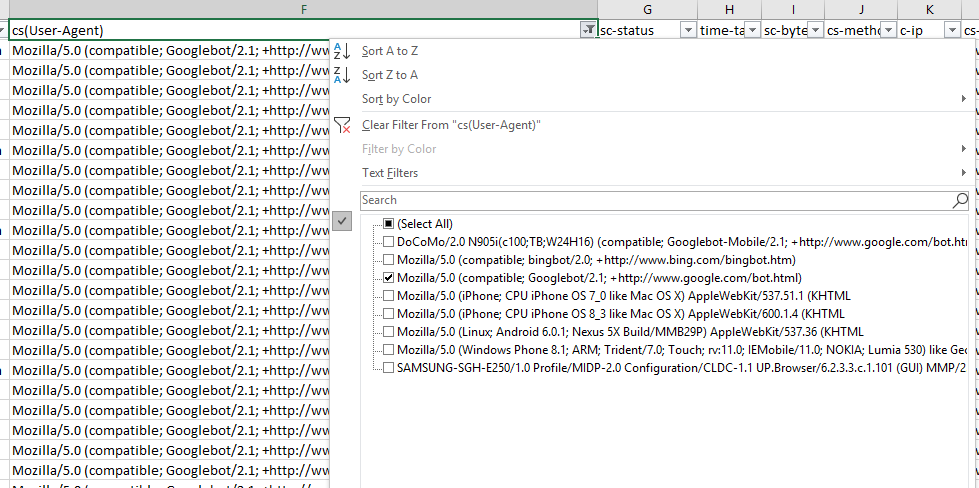
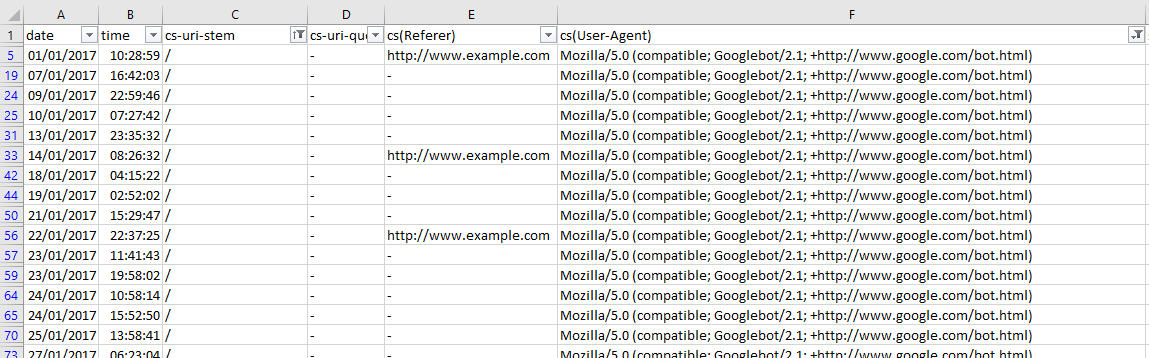
If you’re interested in seeing the behavior of a single user agent, this is easy as filtering out the relevant column in excel. In this case, with a WC3 format log file, I’m filtering the cs(User-Agent) column by Googlebot:
And then filtering the URI column to show the number of times Googlebot crawled the home page of this example site:
This is a fast way of seeing if there are any problem areas by URI stem for a singular user-agent. You can take this a step further by looking at the filtering options for the URI stem column, which in this case is cs-uri-stem:
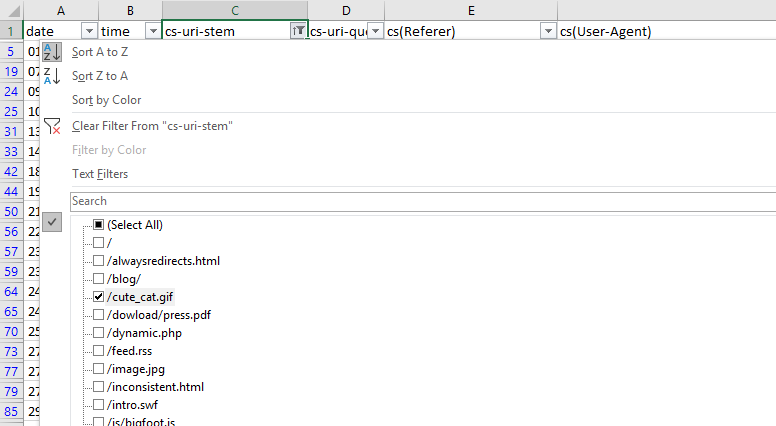
From this basic menu, we can see what URLs, including resource files, are being crawled to quickly identify any problem URLs (parameterized URLs that shouldn’t be being crawled for example).
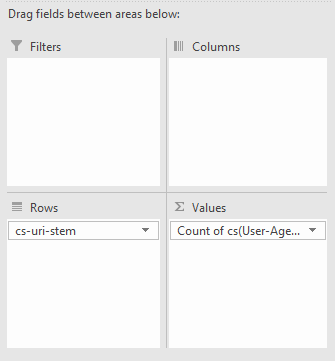
You can also do broader analyses with Pivot tables. To get the number of times a particular user agent has crawled a specific URL, select the whole table (Ctrl/cmd + A), go to Insert > Pivot Table and then use the following options:
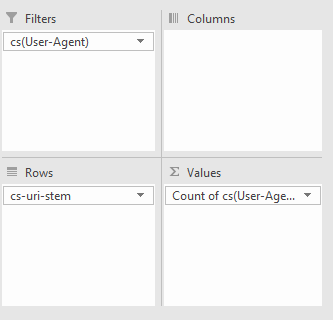
All we’re doing is filtering by User Agent, with the URL stems as rows, and then counting the number of times each User-agent occurs.
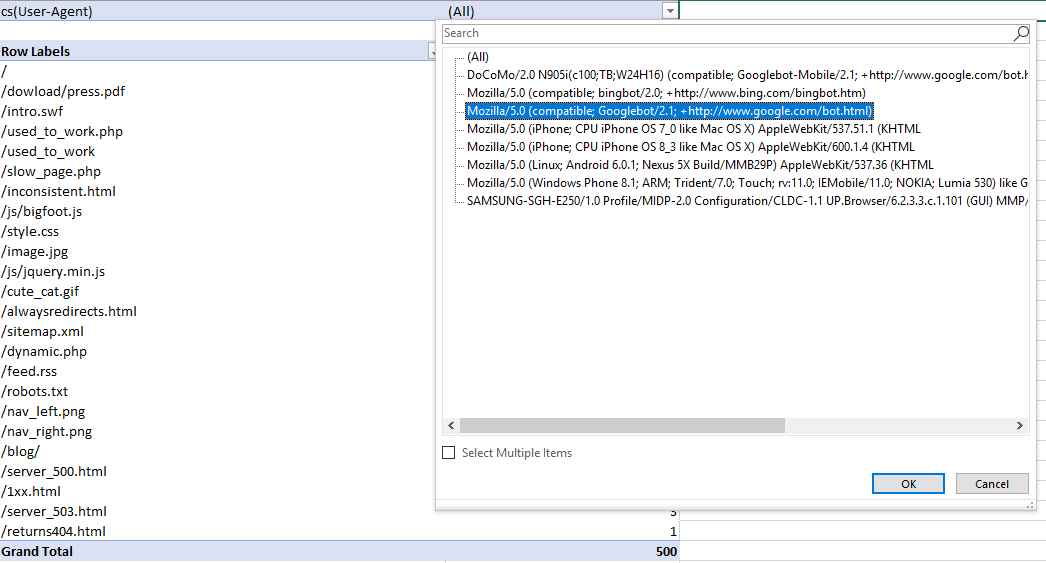
With my example log file, I got the following:
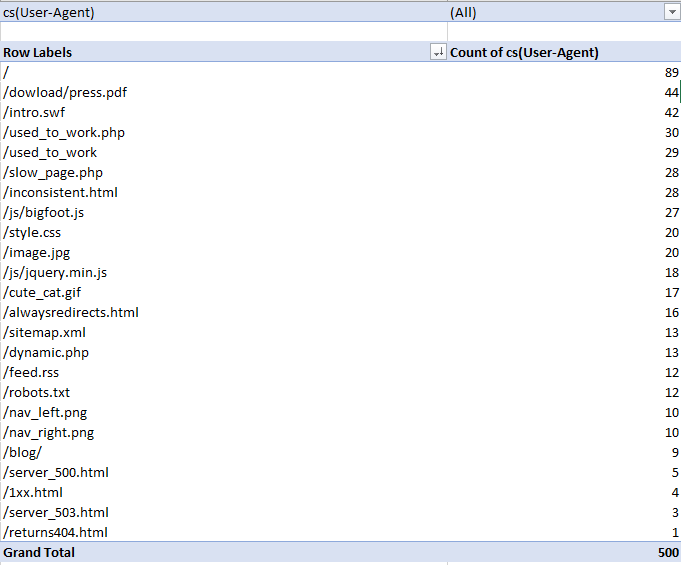
Then, to filter by specific User-Agent, I clicked the drop-down icon on the cell containing “(All),” and selected Googlebot:
Understanding what different bots are crawling, how mobile bots are crawling differently to desktop, and where the most crawling is occurring can help you see immediately where there is crawl budget waste and what areas of the site need improvement.
Find low-value add URLs
Crawl budget should not be wasted on Low value-add URLs, which are normally caused by session IDs, infinite crawl spaces, and faceted navigation.
To do this, go back to your log file, and filter by URLs that contain a “?” or question mark symbols from the URL column (containing the URL stem). To do this in Excel, remember to use “~?” or tilde question mark, as shown below:
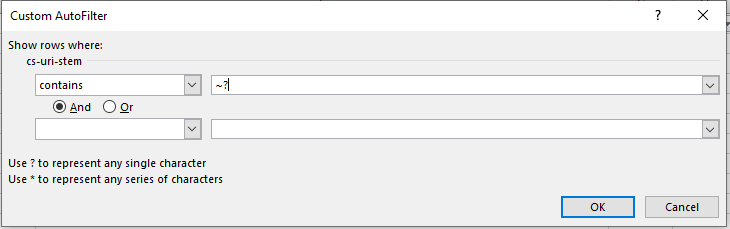
A single “?” or question mark, as stated in the auto filter window, represents any single character, so adding the tilde is like an escape character and makes sure to filter out the question mark symbol itself.
Isn’t that easy?
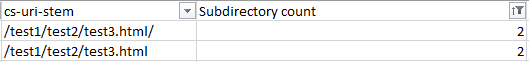
Find duplicate URLs
Duplicate URLs can be a crawl budget waste and a big SEO issue, but finding them can be a pain. URLs can sometimes have slight variants (such as a trailing slash vs a non-trailing slash version of a URL).
Ultimately, the best way to find duplicate URLs is also the least fun way to do so — you have to sort by site URL stem alphabetically and manually eyeball it.
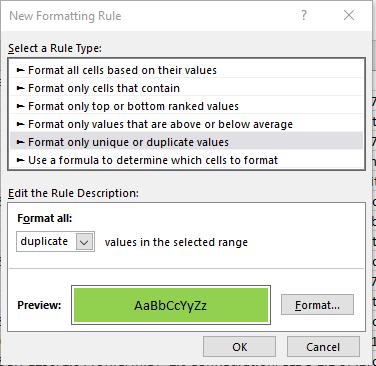
One way you can find trailing and non-trailing slash versions of the same URL is to use the SUBSTITUTE function in another column and use it to remove all forward slashes:
=SUBSTITUTE(C2, “/”, “”)
In my case, the target cell is C2 as the stem data is on the third column.
Then, use conditional formatting to identify duplicate values and highlight them.
However, eyeballing is, unfortunately, the best method for now.
See the crawl frequency of subdirectories
Finding out which subdirectories are getting crawled the most is another quick way to reveal crawl budget waste. Although keep in mind, just because a client’s blog has never earned a single backlink and only gets three views a year from the business owner’s grandma doesn’t mean you should consider it crawl budget waste — internal linking structure should be consistently good throughout the site and there might be a strong reason for that content from the client’s perspective.
To find out crawl frequency by subdirectory level, you will need to mostly eyeball it but the following formula can help:
=IF(RIGHT(C2,1)="/",SUM(LEN(C2)-LEN(SUBSTITUTE(C2,"/","")))/LEN("/")+SUM(LEN(C2)-LEN(SUBSTITUTE(C2,"=","")))/LEN("=")-2, SUM(LEN(C2)-LEN(SUBSTITUTE(C2,"/","")))/LEN("/")+SUM(LEN(C2)-LEN(SUBSTITUTE(C2,"=","")))/LEN("=")-1)
The above formula looks like a bit of a doozy, but all it does is check if there is a trailing slash, and depending on the answer, count the number of trailing slashes and subtract either 2 or 1 from the number. This formula could be shortened if you remove all trailing slashes from your URL list using the RIGHT formula — but who has the time. What you’re left with is subdirectory count (starting from 0 from as the first subdirectory).
Replace C2 with the first URL stem / URL cell and then copy the formula down your entire list to get it working.
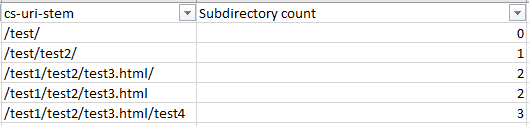
Make sure you replace all of the C2s with the appropriate starting cell and then sort the new subdirectory counting column by smallest to largest to get a good list of folders in a logical order, or easily filter by subdirectory level. For example, as shown in the below screenshots:
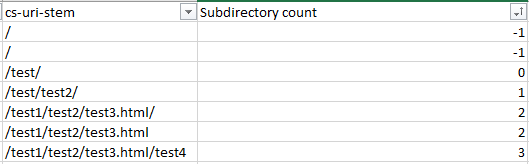
The above image is subdirectories sorted by level.
The above image is subdirectories sorted by depth.
If you’re not dealing with a lot of URLs, you could simply sort the URLs by alphabetical order but then you won’t get the subdirectory count filtering which can be a lot faster for larger sites.
See crawl frequency by content type
Finding out what content is getting crawled, or if there are any content types that are hogging crawl budget, is a great check to spot crawl budget waste. Frequent crawling on unnecessary or low priority CSS and JS files, or how crawling is occurring on images if you are trying to optimize for image search, can easily be spotted with this tactic.
In Excel, seeing crawl frequency by content type is as easy as filtering by URL or URI stem using the Ends With filtering option.
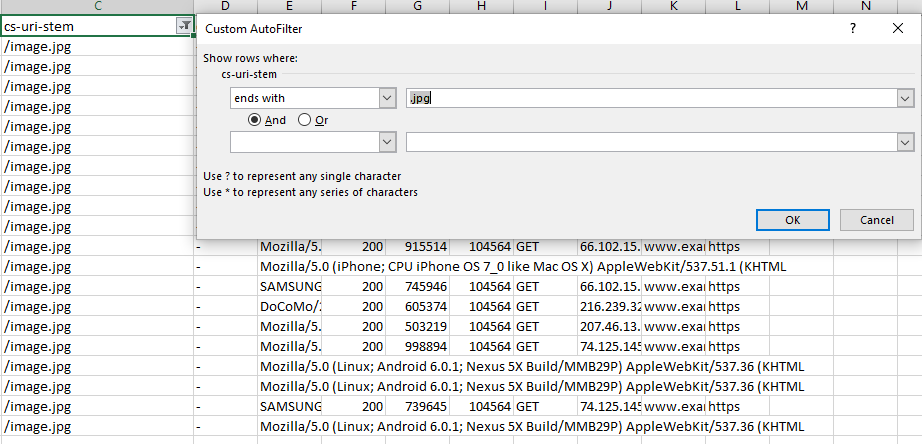
Quick Tip: You can also use the “Does Not End With” filter and use a .html extension to see how non-HTML page files are being crawled — always worth checking in case of crawl budget waste on unnecessary js or css files, or even images and image variations (looking at you Wordpress). Also, remember if you have a site with trailing and non-trailing slash URLs to take that into account with the “or” operator with filtering.
Spying on bots: Understand site crawl behavior
Log File Analysis allows us to understand how bots behave by giving us an idea of how they prioritize. How do different bots behave in different situations? With this knowledge, you can not only deepen your understanding of SEO and crawling, but also give you a huge leap in understanding the effectiveness of your site architecture.
See most and least crawled URLs
This strategy has been touched up previously with seeing crawled URLs by user-agent, but it’s even faster.
In Excel, select a cell in your table and then click Insert > Pivot Table, make sure the selection contains the necessary columns (in this case, the URL or URI stem and the user-agent) and click OK.
Once you have your pivot table created, set the rows to the URL or URI stem, and the summed value as the user-agent.
From there, you can right-click in the user-agent column and sort the URLs from largest to smallest by crawl count:
Now you’ll have a great table to make charts from or quickly review and look for any problematic areas:
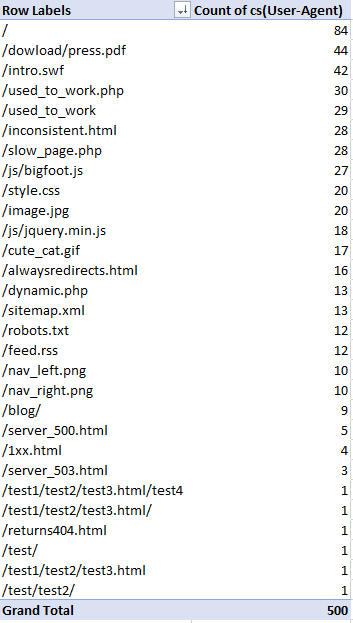
A question to ask yourself when reviewing this data is: Are the pages you or the client would want being crawled? How often? Frequent crawling doesn’t necessarily mean better results, but it can be an indication as to what Google and other content user-agents prioritize most.
Crawl frequency per day, week, or month
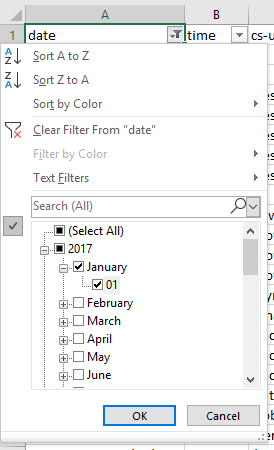
Checking the crawling activity to identify issues where there has been loss of visibility around a period of time, after a Google update or in an emergency can inform you where the problem might be. This is as simple as selecting the “date” column, making sure the column is in the “date” format type, and then using the date filtering options on the date column. If you’re looking to analyze a whole week, just select the corresponding days with the filtering options available.
Crawl frequency by directive
Understanding what directives are being followed (for instance, if you are using a disallow or even a no-index directive in robots.txt) by Google is essential to any SEO audit or campaign. If a site is using disallows with faceted navigation URLs, for example, you’ll want to make sure these are being obeyed. If they aren’t, recommend a better solution such as on-page directives like meta robots tags.
To see crawl frequency by directive, you’ll need to combine a crawl report with your log file analysis.
(Warning: We’re going to be using VLOOKUP, but it’s really not as complicated as people make it out to be)
To get the combined data, do the following:
- Get the crawl from your site using your favorite crawling software. I might be biased, but I’m a big fan of the Screaming Frog SEO Spider, so I’m going to use that.
If you’re also using the spider, follow the steps verbatim, but otherwise, make your own call to get the same results.
- Export the Internal HTML report from the SEO Spider (Internal Tab > “Filter: HTML”) and open up the “internal_all.xlsx” file.

From there, you can filter the “Indexability Status” column and remove all blank cells. To do this, use the “does not contain” filter and just leave it blank. You can also add the “and” operator and filter out redirected URLs by making the filter value equal “does not contain → “Redirected” as shown below:

This will show you canonicalized, no-index by meta robots and canonicalized URLs.
- Copy this new table out (with just the Address and Indexability Status columns) and paste it in another sheet of your log file analysis export.
- Now for some VLOOKUP magic. First, we need to make sure the URI or URL column data is in the same format as the crawl data.
Log Files don’t generally have the root domain or protocol in the URL, so we either need to remove the head of the URL using “Find and Replace” in our newly made sheet, or make a new column in your log file analysis sheet append the protocol and root domain to the URI stem. I prefer this method because then you can quickly copy and paste a URL that you are seeing problems with and take a look. However, if you have a massive log file, it is probably a lot less CPU intensive with the “Find and Replace” method.
To get your full URLs, use the following formula but with the URL field changed to whatever site you are analyzing (and make sure the protocol is correct as well). You’ll also want to change D2 to the first cell of your URL column
=”
Drag” class=”redactor-autoparser-object”>https://www.example.com”&D… down the formula to the end of your Log file table and get a nice list of full URLs:
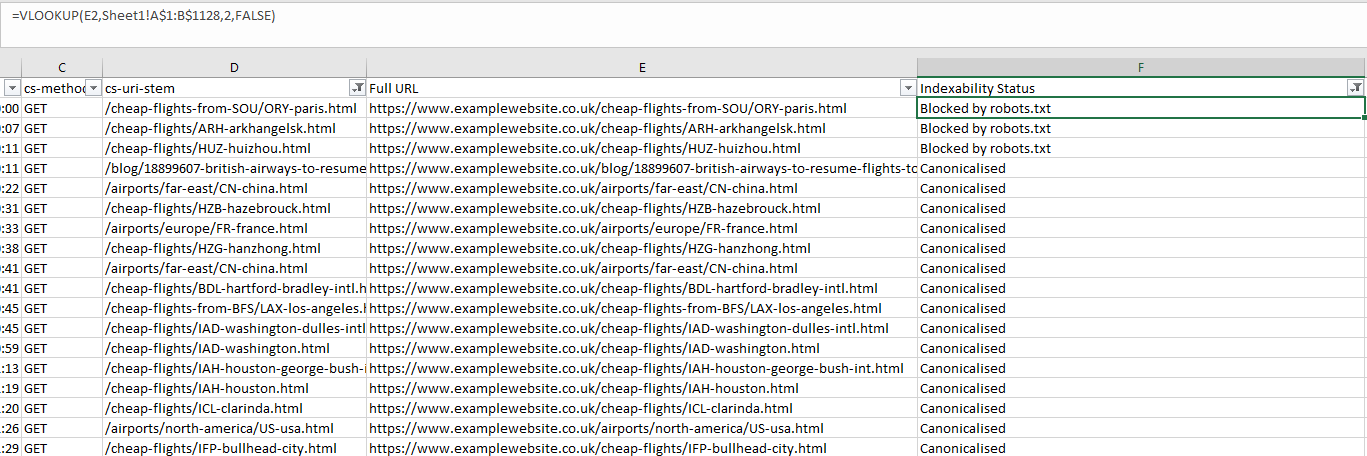
- Now, create another column and call it “Indexability Status”. In the first cell, use a VLOOKUP similar to the following: =VLOOKUP(E2,CrawlSheet!A$1:B$1128,2,FALSE). Replace E2 with the first cell of you “Full URL” column, then make the lookup table into your new. crawl sheet. Remember to sue the dollar signs so that the lookup table doesn’t change as you. apply the formula to further roles. Then, select the correct column (1 would be the first column of the index table, so number 2 is the one we are after). Use the FALSE range lookup mode for exact matching. Now you have a nice tidy list of URLs and their indexability status matched with crawl data:
Crawl frequency by depth and internal links
This analysis allows us to see how a site’s architecture is performing in terms of crawl budget and crawlability. The main aim is to see if you have far more URLs than you do requests — and if you do then you have a problem. Bots shouldn’t be “giving up” on crawling your entire site and not discovering important content or wasting crawl budget on content that is not important.
Tip: It is also worth using a crawl visualization tool alongside this analysis to see the overall architecture of the site and see where there are “off-shoots” or pages with poor internal linking.
To get this all-important data, do the following:
- Crawl your site with your preferred crawling tool and export whichever report has both the click depth and number of internal links with each URL.
In my case, I’m using the Screaming Frog SEO Spider, going exporting the Internal report:

- Use a VLOOKUP to match your URL with the Crawl Depth column and the number of Inlinks, which will give you something like this:

- Depending on the type of data you want to see, you might want to filter out only URLs returning a 200 response code at this point or make them filterable options in the pivot table we create later. If you’re checking an e-commerce site, you might want to focus solely on product URLs, or if you’re optimizing crawling of images you can filter out by file type by filtering the URI column of your log file using the “Content-Type” column of your crawl export and making an option to filter with a pivot table. As with all of these checks, you have plenty of options!
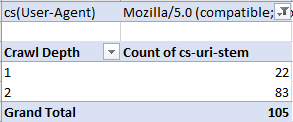
- Using a pivot table, you can now analyze crawl rate by crawl depth (filtering by the particular bot in this case) with the following options:
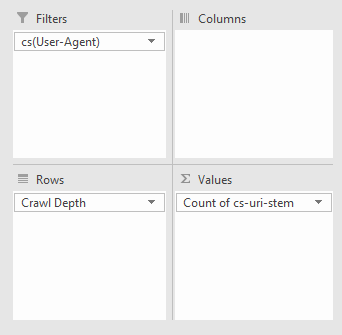
To get something like the following:
Better data than Search Console? Identifying crawl issues
Search Console might be a go-to for every SEO, but it certainly has flaws. Historical data is harder to get, and there are limits on the number of rows you can view (at this time of writing it is 1000). But, with Log File Analysis, the sky’s the limit. With the following checks, we’re going to be discovered crawl and response errors to give your site a full health check.
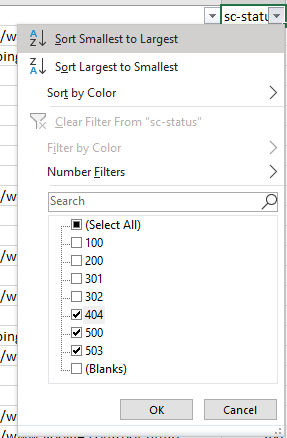
Discover Crawl Errors
An obvious and quick check to add to your arsenal, all you have to do is filter the status column of your log file (in my case “sc-status” with a W3C log file type) for 4xx and 5xx errors:
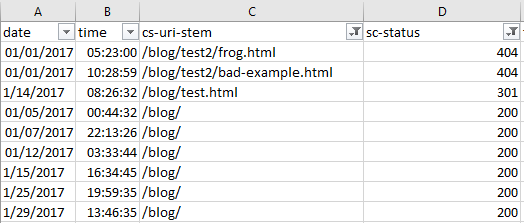
Find inconsistent server responses
A particular URL may have varying server responses over time, which can either be normal behavior, such as when a broken link has been fixed or a sign there is a serious server issue occurring such as when heavy traffic to your site causes a lot more internal server errors and is affecting your site’s crawlability.
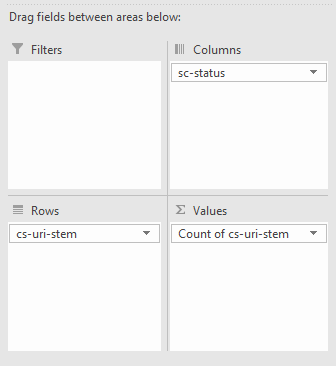
Analyzing server responses is as easy as filtering by URL and by Date:
Alternatively, if you want to quickly see how a URL is varying in response code, you can use a pivot table with the rows set to the URL, the columns set to the response codes and counting the number of times a URL has produced that response code. To achieve this setup create a pivot table with the following settings:
This will produce the following:
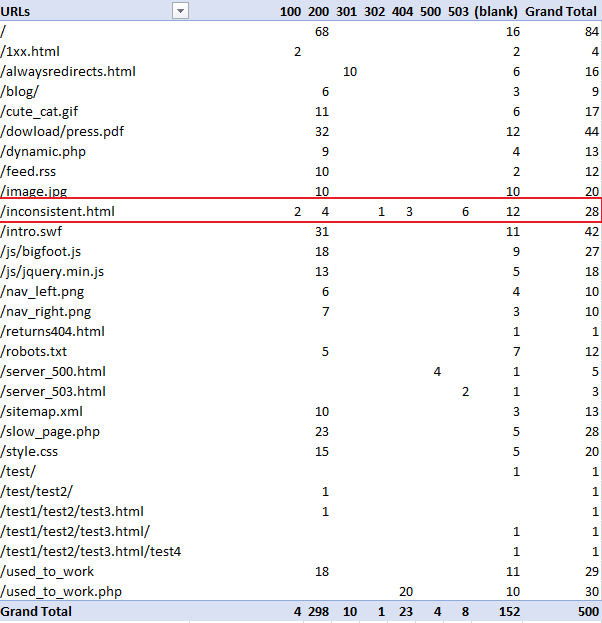
As you can see in the above table, you can clearly see “/inconcistent.html” (highlighted in the red box) has varying response codes.
View Errors by Subdirectory
To find which subdirectories are producing the most problems, we just need to do some simple URL filtering. Filter out the URI column (in my case “cs-uri-stem”) and use the “contains” filtering option to select a particular subdirectory and any pages within that subdirectory (with the wildcard *):
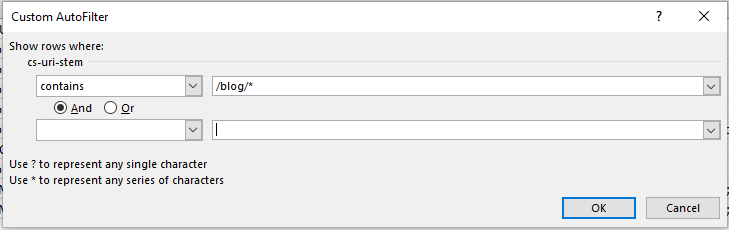
For me, I checked out the blog subdirectory, and this produced the following:
View Errors by User Agent
Finding which bots are struggling can be useful for numerous reasons including seeing the differences in website performance for mobile and desktop bots, or which search engines are best able to crawl more of your site.
You might want to see which particular URLs are causing issues with a particular bot. The easiest way to do this is with a pivot table that allows for filtering the number of times a particular response code occurs per URI. To achieve this make a pivot table with the following settings:
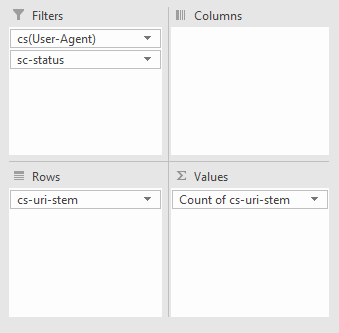
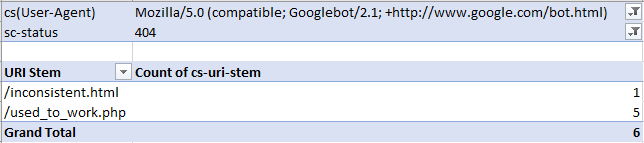
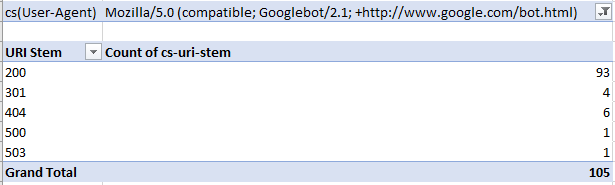
From there, you can filter by your chosen bot and response code type, such as image below, where I’m filtering for Googlebot desktop to seek out 404 errors:
Alternatively, you can also use a pivot table to see how many times a specific bot produces different response codes as a whole by creating a pivot table that filters by bot, counts by URI occurrence, and uses response codes as rows. To achieve this use the settings below:
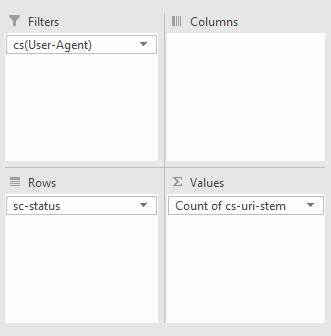
For example, in the pivot table (below), I’m looking at how many of each response code Googlebot is receiving:
Diagnose on-page problems
Websites need to be designed not just for humans, but for bots. Pages shouldn’t be slow loading or be a huge download, and with log file analysis, you can see both of these metrics per URL from a bot’s perspective.
Find slow & large pages
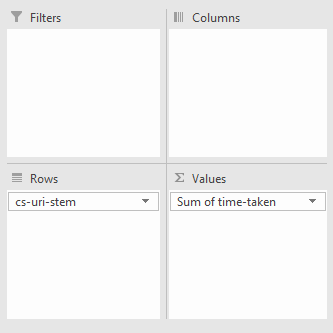
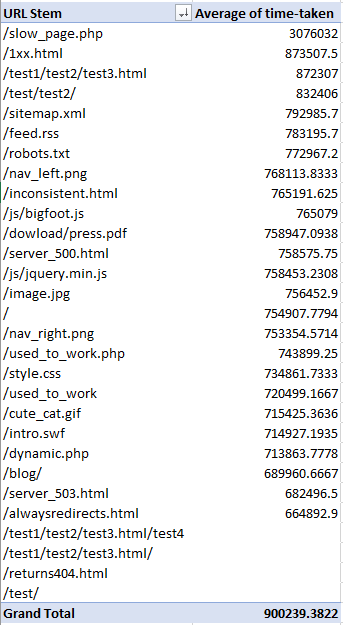
While you can sort your log file by the “time taken” or “loading time” column from largest to smallest to find the slowest loading pages, it’s better to look at the average load time per URL as there could be other factors that might have contributed to a slow request other than the web page’s actual speed.
To do this, create a pivot table with the rows set to the URI stem or URL and the summed value set to the time taken to load or load time:
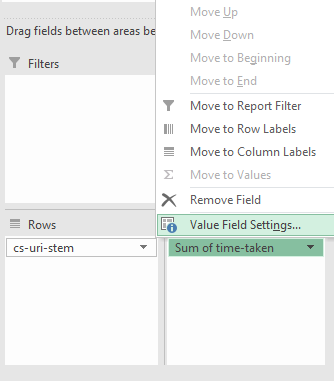
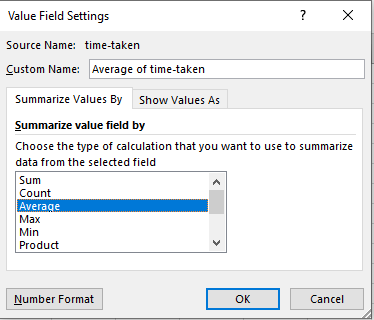
Then using the drop-down arrow, in this case, where it says “Sum of time-taken” and go to “Value Field Settings”:
In the new window, select “Average” and you’re all set:
Now you should have something similar to the following when you sort the URI stems by largest to smallest and average time taken:
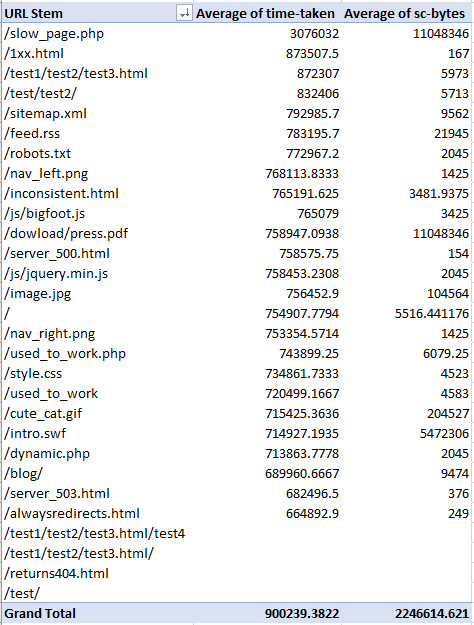
Find large pages
You can now add the download size column (in my case “sc-bytes”) using the settings shown below. Remember that the set the size to the average or sum depending on what you would like to see. For me, I’ve done the average:
And you should get something similar to the following:
Bot behavior: Verifying and analyzing bots
The best and easiest way to understand bot and crawl behavior is with log file analysis as you are again getting real-world data, and it’s a lot less hassle than other methods.
Find un-crawled URLs
Simply take the crawl of your website with your tool of choice, and then take your log file an compare the URLs to find unique paths. You can do this with the “Remove Duplicates” feature of Excel or conditional formatting, although the former is a lot less CPU intensive especially for larger log files. Easy!
Identify spam bots
Unnecessary server strain from spam and spoof bots is easily identified with log files and some basic command line operators. Most requests will also have an IP associated with it, so using your IP column (in my case, it is titled “c-ip” in a W3C format log), remove all duplicates to find each individual requesting IP.
From there, you should follow the process outlined in Google’s document for verifying IPs (note: For Windows users, use the nslookup command):
https://support.google.com/webmasters/answer/80553?hl=en
Or, if you’re verifying a bing bot, use their handy tool:
https://www.bing.com/toolbox/verify-bingbot
Conclusion: Log Files Analysis — not as scary as it sounds
With some simple tools at your disposal, you can dive deep into how Googlebot behaves. When you understand how a website handles crawling, you can diagnose more problems than you can chew — but the real power of Log File Analysis lies in being able to test your theories about Googlebot and extending the above techniques to gather your own insights and revelations.
What theories would you test using log file analysis? What insights could you gather from log files other than the ones listed above? Let me know in the comments below.
Sign up for The Moz Top 10, a semimonthly mailer updating you on the top ten hottest pieces of SEO news, tips, and rad links uncovered by the Moz team. Think of it as your exclusive digest of stuff you don’t have time to hunt down but want to read!